Main
The BAF complex remodels chromatin by repositioning or evicting nucleosomes, which enables transcription, transcription factor (TF) binding and DNA replication1,2,3,4. Genes encoding BAF subunits are among the most frequently mutated in cancer, with LOF alterations present in around 20% of patients across nearly every tumour type3,5,6. Despite the widespread involvement of BAF complexes across cancers, a unifying mechanism of how BAF LOF contributes to transformation across diverse tissue types has not been clearly established.
In mammals, BAF complexes are highly diverse and feature numerous non-catalytic auxiliary subunits. So far, three main BAF complexes have been characterized in mammalian cells: the cBAF complex, the polybromo-BAF complex (PBAF) and the non-canonical BAF complex (ncBAF). Each of these has distinct and overlapping biochemical properties, chromatin targets and roles in disease7,8,9,10,11. The mechanisms by which mutations in BAF complexes promote oncogenesis include impaired chromatin accessibility at key enhancers and promoters and altered dynamics of interactions between transcriptional co-activators and TFs3,4,12,13. However, it remains unclear whether BAF LOF affects chromatin structure beyond nucleosome positioning and whether different BAF subunits have distinct or shared functions across tissues.
Beyond nucleosome positioning, epigenetic and transcriptional programming is controlled through higher-order architectural remodelling of the genome. However, it is unclear whether BAF complexes regulate 3D genome organization, despite growing evidence that other chromatin remodellers have a role in higher-order chromatin folding14,15,16. Although architectural proteins such as CTCF and cohesin have been extensively studied17,18,19,20, how BAF influences higher-order chromatin structures and regulates chromatin topology has not been fully explored. BAF complexes have a crucial role in nucleosome remodelling, and emerging links have been identified between other chromatin remodellers and higher-order genome organization21,22,23. On the basis of these findings, here we propose that disruptions in BAF function converge on a unifying mechanism of 3D genome reorganization. This mechanism could explain how distinct BAF LOF mutations drive oncogenesis across multiple tissue types.
BAF loss opens CTCF sites across tissues
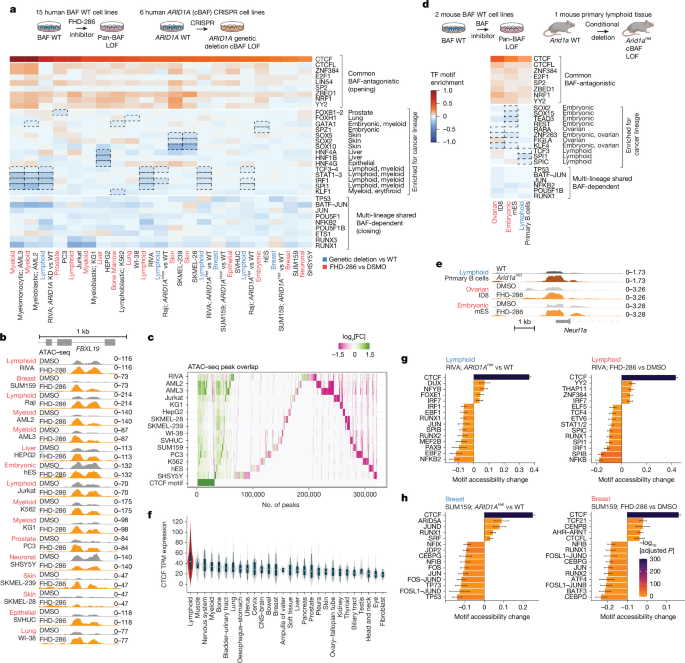
Because BAF mutations predominantly cause LOF5,6 and ARID1A is the most frequently mutated BAF subunit with recurrent truncating alterations24, we modelled BAF dysfunction through ARID1A deletion (cBAF LOF) and the compound FHD-286, a SMARCA4 and SMARCA2 inhibitor24,25,26,27,28,29. We treated 15 human cell lines—including cancer cells from diverse tissues, human embryonic stem (hES) cells and non-cancerous immortalized lines—with FHD-286 for 24 h (Fig. 1a,b). All treated cell lines were BAF wild-type (WT) except SHSY5Y, which carries a SMARCA4 missense variant of unknown function (p.R973W)30. We also generated six isogenic lines using RIVA (lymphoma), Raji (lymphoma) and SUM159 (breast cancer) cell lines with heterozygous ARID1A (ARID1AHet) or homozygous ARID1A (ARID1AHom) deletions or knockdown via short hairpin RNA, as well as WT ARID1A.
a, Schematic (top) and results (bottom) of motif analysis of gained ATAC–seq peaks after BAF inhibition across 15 human cell lines treated with DMSO (n = 3) or the pan-BAF inhibitor FHD-286 (red; n = 3) and 6 lines with ARID1A depletion (blue; n = 3 per genotype). TF motif enrichment was calculated using a previously published algorithm24,41. TFs classified as ‘multi-lineage shared BAF-dependent (closing)’ were closing in at least two cell lines and those classified as ‘common BAF-antagonistic (opening)’ were opening in at least two cell lines. ‘Enriched for tissue specificity TFs’ were selected from published tissue-specific enrichment data39,86,87,88,89,90. The dashed line highlights enrichment of tissue-specific TFs. All samples passed quality control (Supplementary Fig. 5). The colour key for treatments applied to cell lines is used throughout the figures. b, Single-locus genome browser example showing increased chromatin accessibility after FHD-286 treatment across tissues. Differences between FHD-286-treated and WT cells are shown as the coefficient difference of ATAC–seq accessibility of peaks containing the indicated TF motif. c, ATAC–seq peak overlap analysis across tissues comparing FHD-286 and DMSO treatments. Columns denote peaks ordered by the discrete pattern of each peak across all comparisons, classified in each comparison as significantly opening or closing, unchanged or absent. log2[FC], log2 fold change. d, Schematic (top) and results (bottom) of the ATAC–seq analysis of mouse cell lines treated with FHD-286, and primary germinal centre B cells from Arid1aHet mice and Arid1a WT mice. n = 3 per condition. mES, mouse embryonic stem cells. e, Representative locus for d. f, Baseline CTCF expression levels (transcripts per million; TPM) across malignant cells from DepMap. Inner box plots indicate the median and interquartile range (Q1–Q3). n provided in the Methods. g, Top TFs with altered motif accessibility for RIVA cells coloured by multivariate adjusted P value. Bars show robust multivariable linear model coefficients ±95% Wald confidence intervals (CI) and P values are from two-sided coefficient tests with Benjamini–Hochberg (BH) adjustment. Statistics calculated across accessible peaks, n of peaks shown in Supplementary Table 1. Peaks were derived from n = 3 technical replicates per condition. h, Same as g, but for SUM159 cells. n of peaks provided in Supplementary Table 1, and peaks were derived from n = 3 per condition. Icons in d created in BioRender; Debek, S. https://biorender.com/4tx6w5k (2026).
Using ATAC–seq to assess chromatin accessibility, we identified regions where chromatin either opened or closed following BAF complex loss or inhibition. Analyses of sites with reduced chromatin accessibility (in closing peaks) did not identify TFs common across cell types. Instead, TFs in closing regions were specific to the cell type (for example, SOX5 in skin, HNF4A in liver and SPI1 in lymphoid and myeloid cell lines; Fig. 1a,b and Supplementary Figs. 2 and 3). Many of these TFs interact with BAF complexes (for example, JUN, BATF, NFKB2, ETS1, SPI1, POU5F1 (also known as OCT4), SOX2 and SOX10)21,24. This result supports the notion that BAF complexes modulate cell-context-specific TF activity3,31,32,33,34,35,36,37,38. By contrast, opening peaks were enriched for CTCF motifs in 20 out of the 21 cell lines (Fig. 1a,b and Supplementary Figs. 2, 3 and 5). Opening CTCF peaks showed significantly lower cross-cell-type variability than closing TF peaks, which indicated that there is cell-context-independent CTCF regulation by BAF (Fig. 1c and Extended Data Fig. 1a,b). Notably, the CTCF effect was not driven by a small number of loci. Instead, it was an intermediate but broad and coordinated shift across many sites. For example, in RIVA cells, a comparison between ARID1A knockdown and WT cells showed that CTCF motif peaks accounted for 47% of opening peaks and 5% of closing peaks in ARID1A-deficient cells (Cohen’s h = 1.30, Cramer’s V = 0.51; Extended Data Fig. 1c and Supplementary Table 1).
These effects were conserved in mice. FHD-286-treated mouse cell lines and primary Arid1aHet B cells from Arid1a conditional knockout mice24 also showed the gain in CTCF-site accessibility (Fig. 1d,e). Overall, the strongest gains occurred in lymphoid and myeloid lines, which also show the highest baseline CTCF mRNA and protein expression across healthy tissues and cancers30,39,40 (Fig. 1f and Extended Data Fig. 1d). An orthogonal TF motif enrichment method, HOMER, confirmed CTCF enrichment across cell lines, with lymphoid and myeloid tissues ranking the highest (Supplementary Fig. 6a). We focused our subsequent experiments on lymphoid (RIVA) and breast cancer (SUM159) models (Fig. 1g,h).
BAF loss increases CTCF–cohesin binding
To directly measure occupancy, we performed CTCF chromatin immunoprecipitation with sequencing (ChIP–seq) in ARID1AHet and WT cells. Chromatin regions that opened after ARID1A deletion showed increased CTCF binding in both lymphoma and breast cancer cells, with stronger gains in the lymphoid line (Fig. 2a,b). Because CTCF cooperates with cohesin at topologically associating domain (TAD) boundaries18,41,42,43,44, we next profiled the core cohesin subunit SMC3. SMC3 occupancy increased globally, most prominently at sites with both enhanced accessibility and higher CTCF binding (Fig. 2a,b and Supplementary Fig. 6b). Moreover, the majority of newly accessible CTCF sites overlapped with SMC3 peaks (Fig. 2c). mRNA levels of CTCF and subunits of cohesin and BAF complexes were unchanged (Supplementary Fig. 6c), as were CTCF protein levels (Supplementary Fig. 6d). This finding indicates that the CTCF gain reflects increased chromatin binding rather than protein abundance.
a, The log2 fold change in CTCF and SMC3 binding (ChIP–seq) between ARID1AHet and WT RIVA and SUM159 cells, ranked by accessibility changes identified by ATAC–seq. Density plots show CTCF and SMC3 ChIP signals at opening and closing regions (n = 2 clones for RIVA, n = 3 clones for SUM159). b, Example genome browser view of CTCF and SMC3 ChIP–seq. c, Overlap of ATAC-seq analysis of CTCF-gained sites with cohesin binding in ARID1AHet and WT RIVA and SUM159 cells. d, Top, schematic of ATAC–seq after CRISPR-mediated CTCF deletion in ARID1A WT background (CTCF CRISPR); CTCF deletion in the ARID1AHet background (ARID1AHet CTCF CRISPR), or in ARID1AHet and WT cells, each subjected to a negative control targeting the luciferase gene (ARID1AHet and ARID1A WT). Bottom, immunoblot shows deletion efficiency. n = 2 biological replicates. e, PCA of the ATAC–seq from d (s.d. > 0.9). f–h, TF motif enrichment calculated as described in Fig. 1a,g, comparing ARID1AHet and WT (f), DKO and WT (rescue; g), as well as CTCF KO and WT cells (control; h). Bars show robust multivariable linear model coefficients ±95% Wald CI and P values are from two-sided coefficient tests with BH adjustment. n of peaks provided in Supplementary Table 1, and peaks were derived from n = 2 biological replicates per condition. i, Density plot of normalized ATAC–seq read changes at regions overlapping with CTCF ChIP peaks (opening in ARID1AHet versus WT cells). j, Overall survival in participants in The Cancer Genome Atlas (TCGA) (PMID: 24071849) stratified by mutation status of CTCF (n = 138), ARID1A (n = 665), CTCF and ARID1A (n = 133) and control (n = 9,867). Hazard ratios (HR) compared with patients without mutations and logrank test calculated using cBioPortal (PMID: 22588877). k, Left, proliferation assay of WT and ARID1AHet RIVA cells with or without CTCF overexpression (OE). Data are from n = 2 independent experiments using distinct clones of each genotype, which generated n = 3 biological replicates in total, with 3–4 technical replicates per biological replicate. Two-way analysis of variance (ANOVA) P values for genotype × time interaction are indicated in the graph. Error bars represent mean ± s.d. Right, immunoblot showing overexpression efficiency. Gel source data are provided in Supplementary Fig. 1.
To test whether CTCF itself drives the gain in accessibility, we acutely depleted CTCF by CRISPR in WT and ARID1AHet lymphoma B cells and performed ATAC–seq 48 h after transfection with CTCF-targeting Cas9 ribonucleoprotein. During this window of time, CTCF loss does not lead to effects on viability or proliferation45,46 (Fig. 2d and Supplementary Fig. 3). Principal component analysis (PCA) separated samples by genotype (Fig. 2e and Supplementary Fig. 4a). Consistent with previous observations24, ARID1A mutations caused loss of accessibility at NF-KB2, NF-KB1, REL and RUNX1 motifs (Fig. 2f). Moreover, CTCF depletion in the ARID1AHet background restored accessibility at CTCF sites to WT levels without affecting other TFs (Fig. 2g,h). These results establish these peaks as bona fide CTCF sites and rule out CTCF as a driver of the other TF-related changes. Accessibility gains correlated genome-wide with the expression of nearby genes, which therefore links them to transcriptional output (Extended Data Fig. 1e). Delta-delta analysis revealed that 93.5% of peaks (1,971 out of 2,108) that opened at CTCF sites in ARID1AHet cells reverted towards WT when CTCF was depleted (Fig. 2i, Extended Data Fig. 1f and Supplementary Fig. 6e,f). To test whether ARID1A heterozygosity acts as a LOF alteration, we compared chromatin accessibility profiles of ARID1AHet cells to those in which ARID1A was completely knocked out. Differential accessibility profiles in ARID1AHet cells strongly overlapped with those of ARID1AHom SUM159 cells and of ARID1A-knockdown RIVA cells, in which full knockout is not viable (Extended Data Fig. 1g).
To determine whether the increased accessibility at CTCF motifs reflects altered nucleosome positioning at the motif itself, we inferred nucleosome positions using nucleoATAC47. The analysis identified a subset of CTCF sites with a nucleosome positioned directly over the CTCF motif in WT cells. This motif-centred nucleosome was displaced in ARID1AHet cells and restored in ARID1AHet cells with CTCF also depleted. This result couples nucleosome displacement after cBAF loss to CTCF occupancy (Extended Data Fig. 1h).
As stronger CTCF sites drive loop extrusion48, we ranked CTCF ChIP–seq peaks by baseline WT intensity and observed that stronger peaks gained greater accessibility in ARID1A-deficient cells than weaker ones (Extended Data Fig. 1i and Supplementary Fig. 6g). These data suggest that ARID1A controls higher-order chromatin organization through CTCF and cohesin distribution.
Acute ARID1A loss drives CTCF gain
To test whether the CTCF response occurs in non-transformed cells, we treated hES cells (MEL-1) with FHD-286 for 24 h. CTCF and SMC3 binding increased, although more weakly than in cancer lines (Supplementary Fig. 6h). This result probably reflects the dependence of pluripotent cells on SWI/SNF for stemness and differentiation that is triggered by prolonged pan-BAF inhibition. To uncouple the immediate chromatin response from differentiation, we engineered an ARID1A dTAG degron in hES cells and performed ATAC–seq, CTCF ChIP–seq and ARID1A ChIP–seq after rapid ARID1A depletion (Extended Data Fig. 2a). CTCF-site accessibility increased at both 6 h and 24 h, with strong enrichment already at 6 h (Extended Data Fig. 2b). ARID1A ChIP–seq confirmed loss of ARID1A occupancy (Extended Data Fig. 2c), and CTCF ChIP–seq showed a consistent, broadly distributed gain across more than 10,000 pre-existing CTCF peaks rather than de novo sites (Extended Data Fig. 2c,d). Furthermore, at the same regions that showed gain of CTCF, we observed a strong loss of ARID1A, which suggested that these loci were previously bound by ARID1A, which prevented CTCF binding (Extended Data Fig. 2c). To validate our findings in an independent setting, we performed a short FHD-286 treatment time course in RIVA cells. CTCF accessibility increased as early as 4 h after treatment, with a progressive increase at 12 h and 24 h, which indicated that CTCF responds rapidly to BAF inhibition. These results provide support for direct chromatin antagonism between BAF activity and CTCF occupancy (Extended Data Fig. 2e).
CTCF loss rescues ARID1A phenotypes
If CTCF functionally mediates the pathogenic consequences of cBAF loss, concurrent CTCF impairment should attenuate them. Consistent with this idea, patients with alterations in both ARID1A and CTCF showed significantly improved overall survival compared with those with an ARID1A alteration alone (Fig. 2j). To test whether this result reflects a deficit in the ARID1A-loss-driven proliferative advantage, we isolated primary mouse embryonic fibroblasts (MEFs) from embryos carrying conditional floxed alleles of Arid1a, Ctcf or both. Deletion was induced by Cre–GFP transduction followed by sorting of GFP-positive cells, and efficient recombination was confirmed by genotyping (Supplementary Figs. 7 and 12a). Arid1a-deficient MEFs proliferated faster than empty-vector controls, and concurrent Ctcf deletion restored proliferation to near-WT levels (Extended Data Fig. 2f,g). This finding indicates that the fitness advantage due to cBAF loss depends on CTCF.
If CTCF gain drives the proliferative phenotype of ARID1A loss, CTCF overexpression alone should phenocopy it. In RIVA lines overexpressing CTCF in ARID1A WT and heterozygous backgrounds, CTCF overexpression in WT cells accelerated growth to ARID1AHet levels (Fig. 2k). High CTCF expression was also associated with more aggressive disease and worse clinical outcomes in patient data (Extended Data Fig. 2h).
cBAF loss splits TADs via CTCF gain
CTCF works with the cohesin complex to form TAD boundaries that confine genomic interactions in specific regions42,49. To directly assess the impact of ARID1A deficiency on chromatin 3D architecture and CTCF-associated loop formation at high resolution, we performed Micro-C50,51 on ARID1AHet and WT lymphoma cells. Consistent with the gain of cohesin and CTCF occupancy, ARID1AHet cells showed increased intra-TAD contacts that were strengthened more than weakened (Fig. 3a), and a global shift towards intra-TAD over inter-TAD interactions (Fig. 3b). Moreover, in line with the gain in CTCF binding, ARID1AHet cells showed TAD splitting at higher frequency than merge, loss or complex rearrangements (Fig. 3c), with new boundaries visible in formerly continuous TADs on contact maps (Fig. 3d). To test whether CTCF gain drives this splitting, we examined insulation scores at sites of differential CTCF and SMC3 binding. Regions gaining CTCF showed increased insulation (a lower insulation score indicates fewer cross-boundary contacts; Fig. 3e), and boundaries overlapping CTCF peaks had higher CTCF binding in ARID1AHet cells than in WT cells (Fig. 3f and Supplementary Fig. 8a). Thus, enhanced CTCF occupancy drives TAD splitting and boundary insulation after cBAF loss.
a, Aggregated TAD analysis plot on a Micro-C matrix showing delta differences between ARID1AHet and WT cells for all TADs (left), increasing-strength TADs (middle) and decreasing-strength TADs (right). TADs are rescaled to a uniform size. n = 6 (2 clones per each genotype, each clone with 3 technical replicates). In the log2 fold change scale, red indicates a significant increase and blue indicates a decrease in contacts between ARID1AHet and WT. b, Contour scatterplot showing log2 fold changes in intra-TAD and inter-TAD connectivity. c, Counts of differential TAD changes identified using DiffDomain. d, Example of TAD splitting shown in contact matrices (WT and ARID1AHet cells) (top), delta difference contact matrices, called loops (middle), and ChIP–seq tracks for CTCF and SMC3 from Fig. 2a–c, highlighting specific regions undergoing domain reorganization (bottom). For CTCF and SMC3 log2 fold change tracks, red and blue indicate positive and negative log2 fold change values, respectively, between ARID1AHet and WT ChIP–seq peaks. Tracks display counts per million signals plotted on a common scale. e, Insulation score changes at TAD boundaries overlapping differentially bound CTCF (left) or SMC3 (right), comparing ARID1AHet with WT cells. P values are from a two-sided Wilcoxon rank-sum test. The centre dot is the median and error bars show 25–75th percentiles. Statistics calculated across TAD boundaries were derived from n = 6 experiments (2 clones in 3 technical replicates). NS, not significant. f, Profile plots of CTCF ChIP signals over CTCF peaks at boundaries that become more insulated (top) or less insulated (bottom), comparing ARID1AHet and WT Micro-C data. g, Left, proportion of gained and lost promoter loops in split TADs in ARID1AHet and WT cells. Right, proportion of promoter loops in split TADs and TADs selected randomly (two-sided proportion test). h, Aggregate peak analysis plots anchored on Mustache-called loops in WT and ARID1AHet cells (bottom) and the connectivity difference (top) between the conditions. i, Schematic representation of the hypothesis. cBAF loss leads to stabilization of CTCF and cohesin binding and increased intra-TAD interactions at the expense of long-range inter-TAD interactions.
To test whether these structural changes are functional, we measured promoter connectivity in split TADs. Split TADs showed a higher proportion of promoters gaining connectivity than both WT counterparts and random unchanged TADs (Fig. 3g). This finding indicates that splitting reinforces local promoter interactions by limiting longer-range contacts. Indeed, genes in strengthened TADs had increased expression in ARID1AHet cells, whereas genes in weakened TADs were unchanged (Supplementary Fig. 8b,c).
One of the main functions of TADs is to enable connection and coordination between genes contained in their borders. Because genes in TADs tend to manifest coordinated epigenetic marks necessary for coordinated expression levels52,53,54, we asked whether splitting disrupts this coordination. We performed RNA-seq and ChIP–seq for H3K27ac, H3K27me3, H3K4me1 and H3.3 marks in ARID1AHet and WT cells, then compared concordance in split, single (preserved boundaries with altered strength) and stable (preserved boundaries and strength) TADs. Split TADs showed greater discordance in chromatin marks and transcription than stable or single TADs (Supplementary Fig. 8d–g), which indicated that splitting establishes distinct chromatin environments. Thus, cBAF normally maintains regulatory coordination by preventing CTCF from subdividing shared domains. Finally, structural loops showed increased connectivity in ARID1AHet cells (Fig. 3h), a result consistent with enhanced cohesin stalling at gained CTCF sites. Together, these results show that cBAF loss reshapes 3D chromatin architecture through increased CTCF and cohesin activity (Fig. 3i).
BAF loss opens insulators in Drosophila
To test whether BAF insulator antagonism is conserved beyond mammals, we examined Drosophila S2 cells, which use a diversified insulator repertoire, including Ctcf, Beaf and Su(Hw). CRISPR depletion of osa, the Drosophila ARID1A orthologue and a core subunit of the BAP complex, increased chromatin accessibility not only at Ctcf motifs but also at Beaf and Su(Hw) motifs (Extended Data Fig. 2i,j). Thus, SWI/SNF loss broadly opens architectural protein-binding sites across metazoans, which indicates that cBAF normally restrains engagement of multiple insulator classes.
CTCF binds PBAF but not cBAF
To identify CTCF cofactors that might mediate 3D architectural changes after cBAF loss, we performed immunoprecipitation followed by mass spectrometry (IP–MS) for CTCF in lymphoid cells. CTCF co-precipitated ISWI subunits, consistent with its previously reported role in CTCF function21, and all PBAF-specific subunits (PBRM1, ARID2, PHF10 and BRD7) together with BAF-shared subunits (SMARCC1, SMARCC2, SMARCE1, SMARCB1, SMARCD1, SMARCD2, SMARCA4, SMARCA2 and BCL7A). By contrast, cBAF-specific and ncBAF-specific subunits were depleted relative to IgG (Fig. 4a, Supplementary Table 2 and Supplementary Fig. 9a). Reciprocal co-immunoprecipitation experiments for BRD7 and PBRM1 recovered CTCF and the PBAF-specific subunit ARID2 but not the cBAF-specific subunit ARID1A (Fig. 4b). IP–MS for PBRM1 recovered all expected PBAF subunits and CTCF at levels comparable to PBAF core subunits (Fig. 4c, Supplementary Table 3 and Supplementary Fig. 9b). These data reveal a previously unknown association between CTCF and all subunits of the PBAF complex.
a, Heatmap (left) and scatterplot (right) of protein–protein interaction analysis by CTCF IP–MS in RIVA cells. Interaction enrichment was calculated relative to matched IgG IP controls (n = 2, with 2 clones per condition). For the colour key, see c. P values by limma moderated t-test; false discovery rate (FDR)-adjusted P < 0.05. b, Reciprocal IP of BRD7, PBRM1 and CTCF followed by immunoblotting. Representative blots from n = 2 independent IP and western blot experiments. c, Same as a, but for PBRM1. n = 6, 2 clones with 3 technical replicates per condition. d, The log2 fold change in PBRM1 and BRD7 binding (ChIP–seq) between ARID1AHet and WT RIVA cells. Batch-corrected data from three independent experiments were analysed (total n = 7 for PBRM1; n = 5 for BRD7). Representative heatmaps, with n = 1 for PBRM1 and n = 3 for BRD7 per condition. e, Genome browser view at an example locus in RIVA ARID1AHet and WT cells. f, The log2 fold change in ARID1A and PBRM1 binding (ChIP–seq) at summits overlapping CTCF peaks in SUM159 cells: ARID1AHet versus WT or FHD-286-treated versus DMSO-treated (WT). n = 2 each for DMSO-treated and FHD-286-treated cells, and n = 3 for ARID1AHet, with 2–3 clones per condition. The peak order is identical across all conditions. g, ATAC–seq after BAF perturbations in RIVA cells (s.d. > 0.9). For specific details of which components of the complexes are inhibited or degraded, see the main text. Dimensionality reduction by t-distributed stochastic neighbour embedding (t-SNE) of normalized, variance-stabilized peak counts showing chromatin accessibility change. n = 3, except for the PBAF inhibitor (n = 2). FHD-286 was performed in a separate experiment (Fig. 1) and batch-corrected for representation in the t-SNE space. h, Genome browser example for samples in g. i, TF motif enrichment of samples from g, calculated as in Fig. 1a,g. Peaks were derived from all biological replicates per condition. j, Cell proliferation assay in WT, ARID1AHet and ARID1AHetARID2Het cells. Plotted data represent n = 2 independent experiments using distinct clones of each genotype, which produced n = 3 for WT and ARID1AHet, and n = 4 for ARID1AHetARID2Het, with 3 technical replicates per biological replicate. Two-way ANOVA P values for genotype × time interaction are indicated in the graph. Error bars: mean ± s.d. k, Same as j, but comparing ARID1AHetARID2Hom cells. Gel source data are provided in Supplementary Fig. 1.
To confirm that CTCF and PBAF interact directly, rather than being co-precipitated on the same DNA fragment, we performed additional CTCF IP and western blot experiments in the presence of endonuclease. The CTCF–PBAF interaction was preserved after DNase and RNase treatment (Extended Data Fig. 3a), and was detected in breast cancer (SUM159) and Burkitt lymphoma (Raji) cells (Extended Data Fig. 3b,c). This result confirms the reproducibility of the relationship across cell types.
To assess whether CTCF associates with fully assembled PBAF, we performed glycerol gradient fractionation and profiled cBAF, PBAF, ISWI, CTCF and cohesin subunits in RIVA ARID1AHet cells and SUM159 ARID1AHom cells alongside their WT counterparts. PBAF components distributed to higher molecular mass fractions as expected. In both cell lines, CTCF co-migration with PBAF-containing fractions was increased in ARID1A-deficient cells compared with WT cells, with the strongest shift in SUM159 ARID1AHom cells (Extended Data Fig. 3d,e and Supplementary Fig. 9c,d). ChIP–seq for PBRM1 and BRD7 showed increased binding in ARID1A-deficient cells, with PBRM1 gained broadly and BRD7 less robustly (Fig. 4d,e and Supplementary Figs. 10 and 11). Because PBRM1 is the last subunit to be incorporated during PBAF assembly55, the broader PBRM1 gain is consistent with the preferential recruitment of fully assembled PBAF to gained CTCF sites after cBAF loss.
cBAF and PBAF have contrasting roles at CTCF sites
The preferential CTCF–PBAF interaction suggested that cBAF and PBAF have opposing roles at CTCF sites: cBAF restricts CTCF function, whereas PBAF promotes it. Because FHD-286 targets both complexes, we asked whether the FHD-286-mediated net chromatin effect primarily reflects cBAF inhibition. ATAC–seq profiles from FHD-286 treated and ARID1A-depleted cells showed strongly overlapping differential peaks and concordant directionality, which indicated that FHD-286 phenocopies cBAF loss (Extended Data Fig. 1g). Integration of FHD-286-induced accessibility changes with ARID1A and PBRM1 ChIP–seq in SUM159 cells revealed that peaks that lost accessibility were enriched for cBAF binding, whereas peaks that gained accessibility were enriched for PBAF binding (Extended Data Fig. 3f–h). This finding indicates that the FHD-286 phenotype is driven largely by cBAF inhibition rather than an equivalent blockade of all BAF assemblies.
To determine whether PBAF remains functionally engaged under FHD-286 treatment despite loss of cBAF, we examined ARID1A and PBRM1 occupancy by ChIP–seq after FHD-286 treatment in SUM159 cells. ARID1A occupancy decreased, whereas PBRM1-associated signals increased, which indicated that pharmacological-mediated BAF inhibition does not eliminate the PBAF program and instead enables a gain of PBAF-linked chromatin function (Fig. 4f). CTCF IP in FHD-286-treated RIVA and SUM159 cells showed preserved CTCF–PBAF association, which indicates that this interaction is not disrupted by the inhibitor (Extended Data Fig. 3i).
To dissect subcomplex-specific contributions, we performed ATAC–seq in cells treated for 24 h with the following inhibitors or degraders: BRD-K98645985, which inhibits ARID1A and ARID1B in cBAF9; FHD-609, which degrades BRD9 in ncBAF27; PBRM1-BD2-IN-8, which inhibits PBRM1 in PBAF56; and FHT006710, which degrades both BRD9 and BRD7 in ncBAF and PBAF. Degraders efficiently depleted their targets without altering ARID1A expression (Extended Data Fig. 3j), and dimensionality reduction separated samples by the complex targeted (Fig. 4g). PBAF inhibition decreased accessibility at CTCF sites, a result consistent with a CTCF-enabling role (Fig. 4h,i). By contrast, cBAF inhibition and ncBAF degradation increased CTCF motif enrichment (Fig. 4h,i), with inferred CTCF binding increased at peaks opened by PBRM1 inhibition (Extended Data Fig. 3k). Thus, PBAF enables CTCF binding, whereas cBAF and ncBAF antagonize it, a result consistent with previous findings that BRD9 loss increases CTCF binding in haematopoietic stem cells57.
To test whether the proliferation gain in ARID1AHet cells depends on PBAF, we generated heterozygous and homozygous deletions of the PBAF subunit ARID2 in the ARID1AHet background. ARID1AHetARID2Het and ARID1AHetARID2Hom cells proliferated slower than ARID1AHet cells in an ARID2 dose-dependent manner (Fig. 4j,k), which eliminated the proliferative advantage of ARID1A loss. This finding indicates that PBAF activity drives the accelerated proliferation of ARID1A mutant lymphoma cells, but does not exclude the fact that loss of other genes could produce similar proliferation effects.
PBAF directs CTCF after cBAF loss
To test whether CTCF, cohesin and PBAF gains colocalize at the same genomic sites, we developed an unbiased multimodal clustering model that integrates ATAC–seq, CTCF ChIP–seq and PBRM1 ChIP–seq data across ARID1AHet and WT cells (Extended Data Fig. 4a,b). This model identified 16 chromatin-state clusters (Extended Data Fig. 4c).
Clusters G1–G8 (CTCF-gain clusters) showed increased CTCF binding in ARID1AHet cells. All CTCF-gain clusters except G3 and G4 also gained PBRM1 and SMC3 binding and expression of the nearest gene, with cluster G8 showing the largest changes (Extended Data Fig. 4d). All clusters gained BRD7 binding, an independent PBAF subunit not used for clustering, as well as the ATPase SMARCA4, consistent with active PBAF remodelling. The same regions gained H3.3 but not H3.1 marks (Extended Data Fig. 4d and Supplementary Fig. 11), which indicated elevated nucleosome turnover at sites of CTCF, PBAF and cohesin gain.
After integration of the inhibitor and degrader ATAC–seq data, the top CTCF-gain clusters G1–G5 gained accessibility after cBAF or ncBAF disruption, mirroring the ARID1AHet versus WT pattern, and lost accessibility after PBAF inhibition (Extended Data Fig. 4e). This result further demonstrates that PBAF enables CTCF binding when cBAF is lost. Clusters G1–G5 also gained accessibility across a panel of multiple cell lines treated with BAF inhibitors (Extended Data Fig. 4f), which indicated that these are sites shared across tissues. Overall, 60–90% of sites in these clusters contained the M1 CTCF motif, which is associated with strong CTCF binding and insulator function58,59, compared with less than 50% in other clusters (Extended Data Fig. 4g). CTCF-gain clusters were also enriched for TAD boundaries, with the strongest gains in insulation at clusters G1–G5 (Extended Data Fig. 4h,i). Together, these data establish that cBAF loss drives TAD reorganization at sites that gain CTCF, PBAF and cohesin, with PBAF functionally replacing cBAF to enable CTCF-mediated insulation.
cBAF loss shortens enhancer–promoter loops via CTCF
Given that PBAF preferentially localizes to promoter–proximal regions6,8, we speculated that cBAF normally maintains long-range enhancer–promoter loops that collapse into short-range promoter–proximal interactions at CTCF–PBAF sites after ARID1A loss. Analyses of Micro-C contact frequency by genomic distance showed that newly opened CTCF peaks in ARID1AHet cells have increased short-range interactions peaking around 500 kb and reduced long-range contacts above 1 Mb (Extended Data Fig. 5a), whereas unchanged CTCF sites showed no such shift. Opened SMC3 peaks showed the same distance shift (Extended Data Fig. 5b), a finding consistent with cohesin-mediated rewiring.
To determine how chromatin rewiring affects promoter function, we performed single-cell multiome profiling in ARID1AHet and WT cells and scored each gene by the correlation between expression and connectivity inferred from peak co-accessibility (Extended Data Fig. 5c). Genes with increased connectivity in ARID1AHet cells showed elevated transcriptional activity (Extended Data Fig. 5d–f). CTCF peaks that gained occupancy after ARID1A loss showed enhanced connectivity and more promoter–enhancer contacts (Extended Data Fig. 5g), and genes overlapping these peaks were upregulated (Extended Data Fig. 5h). PBRM1-bound regions gained in ARID1AHet cells showed the same pattern of increased connectivity, additional promoter–enhancer loops and elevated gene expression (Extended Data Fig. 5i,j), as did sites gained by the independent PBAF subunit BRD7 (Extended Data Fig. 5k,l). Thus, cBAF loss drives PBAF and CTCF to rewire promoter–enhancer contacts towards short-range promoter–proximal interactions that increase gene expression.
PBAF and insulation after cBAF loss
We have thus far shown that cBAF deficiency triggers a CTCF gain-of-function program with two hallmarks: enhanced intra-TAD insulation with domain subdivision and increased promoter–enhancer connectivity. To test which of these hallmarks depend on PBAF, we generated additional Micro-C profiles in ARID1AHet and ARID1AHetARID2Hom RIVA cells. The increased intra-TAD contacts (of single TADs) seen in ARID1AHet cells were attenuated in ARID1AHetARID2Hom cells, with log2(fold change) distributions centring near zero (Extended Data Fig. 6a). Furthermore, the intra-to-inter-TAD ratio, elevated in ARID1AHet cells, returned to WT levels in ARID1AHetARID2Hom cells (Extended Data Fig. 6b), which indicates that there is reduced insulation after PBAF loss in the ARID1A-deficient background.
After stratification of TADs by their ARID1AHet behaviour, ARID2 deletion partially but selectively rescued the strengthening class. That is, strengthened TADs lost contact enrichment in ARID1AHetARID2Hom cells, whereas weakening TADs were unchanged (Extended Data Fig. 6c). Genome-wide Micro-C signals at TAD boundaries, strengthened in ARID1AHet cells, were reduced towards WT levels in ARID1AHetARID2Hom cells (Extended Data Fig. 6d), and representative loci show attenuated boundary strengthening and TAD splitting after ARID2 deletion (Extended Data Fig. 6e).
We next tested whether the promoter–enhancer connectivity gain in ARID1AHet cells depends on PBAF. To that end, we performed additional single-cell multiome analyses that included ARID1AHetARID2Hom RIVA cells (Extended Data Fig. 7a). Connectivity in ARID1AHetARID2Hom cells shifted back towards WT levels (Extended Data Fig. 7a,b), and loops strengthened or gained in ARID1AHet were reduced after ARID2 deletion (Extended Data Fig. 7c,d,i), which indicated that PBAF contributes to the formation or stabilization of these new promoter–enhancer contacts. Expression of genes near gained CTCF or PBAF sites was partially restored towards WT levels in ARID1AHetARID2Hom cells (Extended Data Fig. 7e–h). This result links PBAF-dependent rewiring to the transcriptional consequences of cBAF loss.
ISWI and PBAF enable CTCF gain
As PBAF deficiency only partially rescued the ARID1AHet chromatin phenotype, we tested whether ISWI, a remodeller previously linked to CTCF function and recovered in our CTCF IP–MS data (Fig. 4a), is also involved. We deleted the ISWI catalytic subunit SMARCA5 (also known as SNF2H) in ARID1AHet RIVA cells and performed ATAC–seq. Loss of SMARCA5 strongly reduced accessibility at CTCF motifs in ARID1AHetSMARCA5Hom cells (Extended Data Fig. 8a), which indicated that ISWI is a major contributor to nucleosome remodelling at CTCF motifs after cBAF loss, with PBAF subsequently reinforcing CTCF-dependent insulation and loop architecture.
We next tested whether ISWI is required for the ARID1AHet proliferative phenotype. In independent CRISPR clones, ARID1AHetSMARCA5Hom cells proliferated significantly more slowly than ARID1AHet cells (Extended Data Fig. 8b), which eliminated the proliferative advantage of ARID1A loss. The reduced proliferation rate relative to WT cells is consistent with ISWI loss reducing CTCF accessibility below WT levels (Extended Data Fig. 8a). Thus, like PBAF (Fig. 4j,k), ISWI is required for the proliferative consequences of cBAF loss. However, we cannot exclude the possibility that loss of other essential genes could produce comparable proliferation phenotypes. Our data establish that ISWI activity is necessary, not that it is specifically required.
On the basis of these new data, we favour a model in which PBAF and ISWI contribute to CTCF gain-of-function in the setting of cBAF deficiency, consistent with the antagonistic relationship between cBAF and CTCF for chromatin architecture. At the same time, PBAF and ISWI may act through distinct mechanisms at distinct genomic loci or converge on the same sites. We therefore compared CTCF binding, PBAF binding and ISWI-dependent accessibility. Approximately half of ISWI-dependent CTCF sites were also associated with PBAF. Conversely, about half of shared CTCF and PBAF sites lost accessibility after SMARCA5 deletion (Extended Data Fig. 8c). Thus, PBAF and ISWI frequently converge on the same CTCF-linked regulatory elements, with smaller subsets preferentially dependent on one or the other.
Ctcf loss rescues Arid1a loss in mice
Mutations in components of the BAF complex are particularly common in lymphoid malignancies, with ARID1A the most frequently mutated subunit60,61. More than 35% of diffuse large B cell lymphomas (DLBCLs) carry BAF mutations, and DLBCL arises from germinal centre B cells, which cycle between the highly proliferative dark zone (DZ), where they undergo rapid division and somatic hypermutation, and the light zone (LZ), where they are selected for affinity-matured antigen receptors62,63,64 (Fig. 5a). Each zone is defined by distinct chromatin and transcriptional states. Because the DZ-to-LZ transition involves extensive chromatin and architectural reorganization54,65,66,67, we asked whether ARID1A loss might disrupt this program through CTCF. ATAC–seq of WT germinal centre B cells showed that CTCF motif accessibility was significantly higher in DZ than LZ cells (Fig. 5b), which suggested that there is a CTCF-dependent component to the DZ state. Conditional Arid1a heterozygous deletion in mice can skew the germinal centre reaction towards the DZ24, and reanalyses of ATAC–seq data from these mice revealed that CTCF motifs were the most enriched in newly accessible regions (Fig. 5c). Together, these data link DZ expansion in Arid1a-deficient germinal centres to increased CTCF accessibility.
a, Schematic of the germinal centre reaction. b, TF motif enrichment analysis, as in Fig. 1a,g, comparing DZ and LZ germinal centre B cells in WT mice, showing the top 5 enriched TF motifs. CTCF shows strong enrichment in DZ versus LZ regions. c, ATAC–seq motif analysis in germinal centre B cells in the DZ from Arid1a+/–Cg1cre/+ mice and WT mice. Top enriched motifs are shown. d, Top left, experimental schematic. i.p., intraperitoneal injection; SRBC, sheep red blood cells. Bottom, flow cytometry analyses of DZ expansion in Arid1a+/+Cg1cre/+ (WT; n = 7), Arid1a+/–Cg1cre/+ (Arid1aHet; n = 7), Ctcf+/–Cg1cre/+ (CtcfHet; n = 4) and Arid1a+/–Ctcf+/–Cg1cre/+ (Arid1aHetCtcfHet; n = 8) mice. Top right, quantification demonstrating that Ctcf deletion restores DZ proportions to WT levels (two-sided t-test). Error bars represent the mean ± s.d. e, Z scores of ATAC–seq signals at CTCF-binding sites, showing reduced accessibility after Ctcf deletion at sites that gained opening after Arid1a loss. Black boxes indicate a deletion of the respective gene or denote an experimental batch. f, Motif enrichment difference between Arid1aHetCtcfHet and Arid1aHet conditions in the DZ, calculated as in Fig. 1a,g, demonstrating a net negative enrichment for CTCF motifs. g, Enrichment analysis of chromatin regions rescued in Arid1aHetCtcfHet mice, confirming that these sites are direct CTCF targets co-occupied by PBAF. Enrichment P values calculated by one-sided Fisher’s exact test. h, Uniform manifold approximation and projection (UMAP) dimensionality reduction of batch-corrected RNA and ATAC data showing splenic B cells from WT (n = 60,150 cells), Arid1aHet (n = 14,521 cells) and CtcfHet (n = 3,630 cells) mice, with genotype-specific density projections normalized by cell number. Circles represent DZ regions. i, Chromatin accessibility at CTCF motifs over germinal centre reaction pseudotime (bottom), shown separately by genotype (top) and highlighting Arid1aHet versus WT and CtcfHet versus WT differences (middle). Grey bands show 95% CI. In b, c and f, bars show robust multivariable linear model coefficients ±95% Wald CI and P values are from two-sided coefficient tests with BH adjustment. In b and c, peaks were derived from n = 5 WT DZ, n = 4 WT LZ and n = 3 Arid1aHet mice per condition, and in f, n = 5 for all conditions. Icon in h created in BioRender; Debek, S. https://biorender.com/wj90pea (2026).
To test whether CTCF is required for the observed Arid1a-driven expansion of the DZ, we crossed a conditional Ctcf knockout mouse model (Ctcfflox/floxCg1Cre/Cre), which lacks Ctcf only in germinal centre B cells, with Arid1a-conditional knockout mice (Fig. 5d). Mice were immunized with the T cell-dependent antigen sheep red blood cells to trigger germinal centre formation and Cre recombination. Germinal centre B cells were sorted at day 10, the peak of the immune reaction. Arid1aHetCtcfHet double heterozygosity fully reversed the DZ expansion phenotype (Fig. 5d and Supplementary Fig. 12c). This rescue effect was reproduced with a second T cell-dependent antigen (NP-KLH), a result that confirms its robustness (Extended Data Fig. 9a,b and Supplementary Fig. 12b,c). Notably, double heterozygotes did exhibit restored overall germinal centre size, which is reduced in Arid1a-deficient mice through loss of PU.1 and NF-κB activity24. This result demonstrates that the ARID1A–CTCF axis selectively governs DZ expansion rather than germinal centre formation per se.
To resolve the observed rescue effects at the chromatin level, we performed ATAC–seq on sorted DZ and LZ germinal centre B cells from Arid1aHet, Arid1a WT and Arid1aHetCtcfHet mice. PCA separated samples by cell type along principal component 1 (PC1; 33.4% of variance) and by genotype along PC2, with Arid1aHetCtcfHet cells reverting towards WT (Extended Data Fig. 9c,d). As observed in the lymphoma cell lines (Fig. 2f), Ctcf deletion had a larger effect on reducing accessibility at CTCF sites than Arid1a loss had on increasing it (Fig. 5e,f). Rescued sites were highly enriched for CTCF signatures, based on hypergeometric testing (Fig. 5g), which confirmed them as direct CTCF targets and enriched for a PBAF signature. This result corroborates our observations in cell lines that Arid1a loss redirects remodelling activity from cBAF to PBAF in vivo.
Early CTCF gain drives cBAF tumours
To track chromatin changes during tumour evolution, we performed an in vivo lymphomagenesis time-course experiment, combining Arid1a heterozygosity with BCL2 overexpression (VavP-Bcl2), a cooperating driver that produces a follicular lymphoma-like disease68,69. We chose this combination because ARID1A loss and BCL2 activation frequently co-occur in human lymphomas61. Bone marrow from Bcl2-Tg or Bcl2-TgArid1aHet donors was transplanted into recipient mice, which were euthanized at 2 months (pre-disease), 6 months (early disease) or at overt lymphoma onset. DZ cells were sorted from splenocytes for ATAC–seq at each stage (Extended Data Fig. 9e and Supplementary Fig. 12c).
CTCF was consistently enriched at regions that gained accessibility in Bcl2-TgArid1aHet mice relative to Bcl2-Tg controls, both at individual time points and in aggregate (Extended Data Fig. 9f,g). This result shows that the CTCF accessibility program is engaged early in cBAF-deficient tumour development. PCA separated healthy DZ cells by genotype, and projection of lymphoma samples onto the same PC space resulted in both Arid1a WT and Bcl2-TgArid1aHet lymphomas clustering with Arid1aHet healthy DZ cells rather than Arid1a WT cells (Extended Data Fig. 9e). This finding indicates that chromatin changes that arise during lymphomagenesis overlap with those already present in pre-malignant Arid1aHet cells. Motif enrichment confirmed stronger CTCF accessibility gains in Bcl2-TgArid1aHet lymphomas and weaker gains in Arid1a WT lymphomas (Extended Data Fig. 9f,g). Thus, CTCF accessibility gains mark the earliest chromatin events of cBAF-driven lymphomagenesis.
ARID1A–CTCF axis shapes cell fate in vivo
To resolve cell-fate effects that may be obscured during bulk profiling, we performed single-cell multiome analyses on germinal centre B cells from Arid1aHet, CtcfHet and WT mice (Fig. 5h and Supplementary Fig. 12c). Using published annotations24,70,71, we classified cells as DZ, DZ-to-LZ transition, LZ or recycling (back from LZ to DZ). Arid1a loss expanded the DZ compartment, whereas Ctcf loss expanded the LZ (Fig. 5h). After ordering cells along a germinal centre pseudotime, CTCF motif accessibility was elevated in Arid1aHet cells during the DZ phase and normalized to WT levels by late LZ and pre-memory stages, whereas CtcfHet cells showed the strongest accessibility reduction in DZ cells (Fig. 5i). Thus, ARID1A loss reinforces the DZ program through early CTCF accessibility gains, whereas Ctcf haploinsufficiency blocks DZ establishment, a finding consistent with a model in which excessive CTCF activity after cBAF loss locks cells in a proliferative DZ state.
To test in vivo the central premise of our model, that the Arid1a haploinsufficient phenotype requires PBAF activity, we performed a genetic rescue experiment. We generated a conditional Pbrm1 knockout on the Cg1cre background and crossed it with our Arid1a conditional line, which produced four groups: control (Cg1cre only), Pbrm1Het, Arid1aHet and double heterozygous (Pbrm1HetArid1aHet). After immunization to induce germinal centre formation and Cre-mediated recombination, we quantified DZ and LZ proportions by flow cytometry at the peak immune response. Arid1aHet mice showed the expected DZ-biased hyperproliferative phenotype, whereas Pbrm1HetArid1aHet double heterozygotes were fully restored to WT DZ and LZ proportions (Extended Data Fig. 9h and Supplementary Fig. 12b). This result mirrors the rescue observed with Ctcf heterozygosity and establishes in vivo that PBAF activity is required for the Arid1a LOF phenotype. These data are consistent with a model in which cBAF loss promotes PBAF gain permissive for elevated CTCF binding and altered cell fate.
Discussion
Here we have shown that cBAF loss drives a conserved gain of CTCF and cohesin binding that restructures 3D genome architecture and reprograms transcription, which is enabled by an antagonistic PBAF switch. Our results therefore reveal a previously unrecognized interplay between SWI/SNF chromatin remodellers in controlling 3D genome structure (Fig. 3i). cBAF operates at enhancers to facilitate TF binding and sustain enhancer–promoter communication across long genomic distances3,4,7,31,72,73. When cBAF is depleted, these enhancer–promoter interactions weaken21,74,75,76, which potentially facilitates alternative remodellers to gain influence. We show that PBAF, which primarily functions at promoters and proximal regulatory elements10,11,77,78, gains increased access to chromatin to stabilize short-range promoter interactions and facilitates CTCF binding at TAD boundaries. Our biochemical data show that CTCF directly interacts with both PBAF and ISWI, which provides support for a model in which CTCF coordinates recruitment of these remodellers to effect distinct steps of chromatin opening, CTCF occupancy and domain insulation.
A puzzling aspect of this mechanism is that cBAF, the function of which is to create nucleosome-depleted regions, restricts CTCF binding, with CTCF sites becoming accessible only after cBAF loss. We propose that cBAF limits CTCF binding at a subset of loci by maintaining a nucleosome that is positioned directly over the CTCF motif, which then occludes the binding sequence even when flanking chromatin is remodelled (Extended Data Fig. 1h). When cBAF dosage is reduced, this constraint is relieved and CTCF can engage DNA. Loss of cBAF permits new CTCF binding events that can activate previously silenced genes. Beyond its architectural role, CTCF contains a transactivation domain that decondenses chromatin79 and binds near many active promoters80. Our findings demonstrate that CTCF occupancy gained after cBAF loss actively drives gene expression at newly accessible sites (Extended Data Fig. 4d and Supplementary Fig. 11).
The enhanced cohesin (SMC3) loading following BAF loss is probably a direct consequence of increased CTCF binding, as CTCF directs cohesin binding to DNA loops41,43,67,81. Although SMARCA4 can interact with RAD21 (refs. 82,83), the responsible BAF complex was unclear. Our findings link this interaction to PBAF and CTCF recruitment. When cBAF is removed, cohesin accumulates at CTCF sites, which reinforces loop extrusion stalling and explains the 3D architectural changes we observed: more cohesin terminating loops at newly engaged CTCF sites strengthens insulation and increases intra-domain contact density. Increased CTCF and cohesin at more sites introduces additional loop anchors, which in turn shortens average loop lengths in TADs.
Although cBAF loss increased CTCF accessibility across most of the tissues we profiled, a subset of our cell types did not show significant changes, which suggests that there are cell-type-specific modifiers of this program. Consistent with such context dependence, two studies of T cells reported that PBAF loss, rather than cBAF loss, increased CTCF motif enrichment at newly accessible chromatin84,85. This result is in contrast to our model, in which PBAF stabilizes CTCF binding after cBAF loss. Together with our findings, this discrepancy highlights the context-dependent nature of chromatin remodelling in modifying the function of this antagonism. Context-specific TFs may compete with CTCF for remodeller activity. Additional cofactors that interact with BAF complexes could tune the balance between cBAF and PBAF engagement at CTCF sites. Furthermore, the proliferation rate and cell cycle state may set cohesin availability for CTCF-mediated looping, given the prominent role of cohesin in sister chromatid cohesion.
Methods
Mouse models
The animal experimental procedures were conducted in strict compliance with the guidelines established by Weill Cornell Medicine, following the Guide for the Care and Use of Laboratory Animals, and the standards set by the Association for Assessment and Accreditation of Laboratory Animal Care International. The Research Animal Resource Center, Weill Cornell Medicine’s Institutional Animal Care and Use Committee and the Cornell Institutional Animal Care and Use Committee reviewed and approved all procedures for the mouse study under protocols 2011-0031 (principal investigator (PI): D.B.) and 2025-0008 (PI: D.B.). Mice were maintained under a 12-h light–dark cycle at 20–22 °C and 40–60% relative humidity in a specific pathogen-free facility with ad libitum access to food and water. Experiments involved both male and female mice and were sex-matched and age-matched (ranging from 8 to 16 weeks) unless otherwise specified. All experimental groups included both sexes. No sex-based differences or biases were observed. Arid1a (strain 027717), Cg1cre (strain 010611) and Pbrm1 (strain 031875) mice were sourced from The Jackson Laboratory. The CtcfHet (Ctcf+/-Cg1cre/+) mouse strain was a gift from the laboratory of G. Lauvau. The Arid1a strain was back-crossed to the C57BL/6J background for at least six generations before being used in experiments. In all experiments the Cg1cre/+ allele was used (heterozygous).
Sample sizes were determined on the basis of standards in the field and previous experience with high-throughput sequencing and flow cytometry experiments. ATAC–seq and RNA-seq experiments were performed with multiple biological replicates (n = 2–4 per condition). Littermates were randomly assigned to experimental groups where feasible. All genetic combinations (allelic genotypes) were derived from the same breeding pairs and analysed as littermates to control for genetic background and environmental variation, thereby minimizing potential bias. Experiments included 3–5 animals per group unless otherwise specified. For sequencing experiments (ATAC–seq and RNA-seq), samples were coded and assigned randomized identifiers before experiments and library preparation. Investigators handling and processing samples were blinded to the genotype or treatment group during these steps. For other assays (for example, proliferation or immunoblotting), blinding was not performed; however, objective quantification methods and standardized pipelines were applied uniformly across conditions to minimize bias.
Cell lines
Mammalian cell lines were maintained at 37 °C in a humidified environment comprising 5% carbon dioxide. Cell growth media were supplemented with 2 mmol l–1 GlutaMAX (35050061, Gibco), 10 mmol l–1 HEPES and 1% penicillin G and streptomycin, as well as fetal bovine serum (FBS; A5256801, Gibco), unless indicated otherwise, in the concentrations specified below. Routine examinations were performed in the laboratory to check for any potential mycoplasma contamination in the cell lines. The hES cell research was conducted under the oversight of the ESCRO committee and approved under protocol number 2022-05-001.
HEPG2, ID8 and WI-38 cell lines, as well as HEK293T for virus production, were propagated in Dulbecco’s modified Eagle medium (DMEM) with 10% FBS. K562, KG1 and RIVA (RI-1) cell lines were propagated in Iscove’s modified Dulbecco’s medium (IMDM) with 20% FBS. PC3 and SVHUC lines were cultured in Ham’s F-12K (Kaighn’s) medium with 20% FBS. SUM159 cells were cultured in Ham’s F12 with 10% FBS, insulin (5 μg ml–1) and hydrocortisone (1 μg ml–1). OCI-AML3 and OCI-AML2 cell lines were cultured in alpha-MEM supplemented with 20% FBS. SHSY5Y cells were cultured in DMEM, supplemented with 10% FBS, non-essential amino acids (1:100; 11140050, Gibco) and sodium pyruvate (1:100; 11360070, Gibco). Raji, Jurkat, SK-MEL28 and SK-MEL239 cell lines were cultured with Roswell Park Memorial Institute (RPMI) medium supplemented with 20% FBS. The hES MEL-1 cell line was cultured in essential 8 Flex Base medium and essential 8 Flex 50× supplement (A2858501, Thermo Fisher) with normocin (ant-nr-05, InvivoGen).
The S2 Drosophila melanogaster cell line was maintained at 24 °C in a non-humidified, non-CO2-adjusted atmosphere, cultured in Schneider’s Drosophila medium supplemented with 10% FBS.
All cell lines were obtained from established repositories or collaborators. Specific sources include Accegen (OCI-AML2), the American Type Culture Collection (HEK293T, HEPG2, Jurkat, K562, PC3, Raji, S2, SHSY5Y, SK-MEL28, SVHUC and WI-38), Cytion (SUM159) and DSMZ (RIVA and OCI-AML3). The hES cell line MEL-1 was obtained from G. Macdonald, SK-MEL239 and KG1 cell lines were obtained from the laboratory of D. Landau, and ID8 was obtained from the laboratory of N. B. Chetrit. Cell lines were authenticated by the providers or via STR profiling where available. Cell lines were routinely tested for mycoplasma contamination. The results of the testing were negative.
Drug treatments
Cells were treated with the indicated concentrations unless indicated otherwise in the figures: 5 μM BRD-K98645985 (MedchemExpress), 100 nM FHD-286 (Foghorn Therapeutics), 5 nM FHD609 (Foghorn Therapeutics), 5 nM FHT006710 (Foghorn Therapeutics)91 or 5 μM PBRM1-BD2-IN-8 (MedchemExpress). Control cells were treated with an equivalent volume of vehicle (DMSO). ATAC–seq and ChIP–seq experiments were performed after 24 h of treatment, unless specified otherwise.
Generation of knockout cell lines using CRISPR–Cas9
To generate the double (CTCF and ARID1A, and ARID2 and ARID1A) knockout models in lymphoma cell lines, we used RIVA (RI-1) lines, including the RIVA cell lines with the ARID1A gene reverted to the WT status, using a previously described method24. To generate a breast cancer model with ARID1A deletion, we used the WT SUM159 cell line. The cells were electroporated with a ribonucleoprotein complex, which contained the Alt-R recombinant S.p. HiFi Cas9 nuclease (IDT 1081061), Alt-R CRISPR-Cas9 tracrRNA (IDT 1072534) and Alt-R CRISPR–Cas9 crRNAs, with the crRNAs targeting the following genes: CTCF: CD.Cas9.BNYC8101.AA (5′-CATGCTCGGTTTACCCAAAG-3′) or CD.Cas9.JZFQ4398.AA (5′-ATGCCGAACCAATTCTCCA-3′); ARID2: Hs.Cas9.ARID2.1.AB: (5′-ATTTCATCCACCTCGAAAGC-3′); ARID1A: targeting the precise Q474* mutation region (5′-GGACTTTACTGGTTGTAATA-3′), as well as the WT DNA template (5′-*A*C*AAGGCCCCAGCGGGTATGGTCAACAGGGCCAGACTCCATATTACAACCAGCAAGTCCTCACCCTCAGCAGCAGCAGCCACCCTACTCCCAGCAA*C*C*A-3′) (asterisks indicate phosphorothioate nucleotides that were modified to ensure DNA stability); or SMARCA5: Hs.Cas9.SMARCA5.1.AB (5′-GTCAGAGACGTTTTATTACC-3′). Electroporation was carried out in accordance with the manufacturer’s protocol using a SF Cell Line 96-well Nucleofector kit (V4SC-2096) with the CM-137 program. At 48 h after electroporation, cells were sorted to collect the live population (DAPI-negative after DAPI stain). Given the lethality of CTCF deletion, the CTCF-deficient and ARID1A-deficient cells were monitored for viability with trypan blue exclusion assay, sorted 48 h after electroporation and immediately subjected to ATAC–seq, whereas the remaining cells were used for immunoblotting to verify the efficiency of deletion. In other cases, cells were single-cell sorted into 96-well plates to allow clonal colony formation and generation of stable cell lines. Deletion efficiency was confirmed by immunoblotting before performing further experiments.
For CRISPR–Cas9-mediated deletion of osa in S2 cells, we used Alt-R CRISPR-Cas9 crRNAs: CD.Cas9.SKCP0295.AB (5′-TGTTGACCAACACCCTGTGA-3′) and CD.Cas9.CMBJ6893.AD (5′-GACCAAGAGCAAGACCTGGA-3′). Electroporation was performed using a SF Cell Line 96-well Nucleofector kit (V4SC-2096) with the DS-137 program. The cells were subjected to ATAC–seq 48 h after electroporation, and deletion efficiency was confirmed by immunoblotting.
Generation of CTCF-overexpressing and ARID1A knockdown cell lines using lentiviral transduction
RIVA cell lines stably overexpressing CTCF were generated via lentiviral transduction using pHAGE-CTCF vector (Addgene, 116728). RIVA ARID1A knockdown cells were generated using lentiviruses previously generated in earlier work24. The following antisense guide sequences were used to target ARID1A: ARID1A-7170: TATGTTTACAGTATCAGGTGTA, ARID1A-6964: TTACCATTAAAAACAGTTATGA. Lentiviral particles were produced by transfecting HEK293T cells with the packaging plasmids psPax2 (Addgene, 12260) and psMD2.G (Addgene, 12259) together with the CTCF expression vector at a 4:3:1 ratio. Viral supernatants were collected at 48 and 72 h after transfection, pooled, filtered through a 0.45 μm membrane and concentrated using PEG-it according to the manufacturer’s instructions (LV825A-1, System Biosciences). The concentrated virus was resuspended in PBS supplemented with 25 μmol l–1 HEPES and used to infect RIVA cells. Following transduction, GFP-positive cells were isolated by sorting, and CTCF overexpression was validated by immunoblotting.
Generation of hES cells with an ARID1A degron
The endogenous hES cell ARID1A allele was tagged with dTAG by introducing a FKBPV-2×HA-P2A-NLS-eGFP cassette to the ARID1A carboxy terminus. The construct, including the FKBP12 degron flanked by homology arms 797 bp upstream and 800 bp downstream of the ARID1A C terminus, was ordered from Integrated DNA Technologies. The vector was introduced into MEL-1 hES cells together with the pX330 Cas9 vector and guide RNAs (TGTCCCACGGGCTGTCATGAC, TCATGACAGCCCGTGGGACAC) targeting the ARID1A stop codon using lipofection in mTeSR medium mixed with CloneR solution (1:10). Transfected cells were selected for 48 h with G418 (500 μg ml–1) using mTeSR:CloneR (1:10). After selection, cells were single-cell sorted based on the eGFP reporter fluorescence intensity, and only the high-eGFP population was used for the formation of single-clone colonies. Clonal lines were expanded and characterized by genotyping PCR, and selected homozygous clones were further validated by immunoblotting.
Isolation of MEFs and Cre-mediated gene deletion
MEFs were isolated from either male or female embryonic day 13.5–14.5 embryos obtained from pregnant mice carrying floxed alleles of the gene (or genes) of interest. MEFs were confirmed to be mycoplasma-free and cultured at 37 °C in a humidified incubator with 5% CO2 and low O2 (4%). The MEFs were maintained in DMEM (Corning, 10-013-CV) supplemented with 20% FBS (R&D Systems, S10250 or Gembio, 100–106), 2 mM GlutaMAX (Gibco, 35050061), 0.1 mM MEM non-essential amino acids (Gibco, 11140-050), 100 U ml–1 penicillin, 100 μg ml–1 streptomycin (Gibco, 15140163) and 55 μM β-mercaptoethanol (Gibco, 21985023). For genetic deletion, MEFs were subjected to Cre recombinase-mediated excision of the floxed allele. Cells at p.1 were infected with pMSCV-Cre-IRES-GFP retroviral vector to induce excision, followed by sorting to enrich GFP-positive cells. Control cells were processed similarly with an empty pMSCV-IRES-GFP vector infecting dividing cells, rather than GFP-negative cells to avoid selecting cells with different proliferation potential. Efficient gene deletion was confirmed by PCR genotyping.
Immunoblotting
For immunoblotting, cells were lysed in RIPA buffer (20 mM HEPES KOH pH 7.5, 50 mM β-glycerophosphate, 1 mM EDTA pH 8.0, 1 mM EGTA pH 8.0, 0.5 mM Na3VO4, 100 mM KCl, 10% glycerol and 1% Triton X-100, supplemented with complete protease inhibitor cocktail; Roche, 05056489001). The concentration of proteins in the supernatant was assessed using Bradford reagent (5000205, Bio-Rad) and absorbance acquisition. Lysates were subject to resolution through SDS–PAGE, then transferred to a PVDF membrane overnight. The membrane was subsequently blocked with 5% milk (Bio-Rad 1706404) and probed using primary antibodies in concentrations listed below. The membrane was then incubated with a corresponding peroxidase-conjugated secondary antibody (1:3,000 dilution Cell Signaling Technology (CST), 7074 and 7076), and detected with chemiluminescence substrate (34095, Thermo Scientific) on a ChemiDoc MP Imaging system (Bio-Rad). Densitometry values were subsequently obtained using Fiji software (National Institutes of Health). The following antibodies were used: ACTL6A (A301-391, Bethyl Laboratories; 1:3,500); ARID1A (HPA005456, Sigma Aldrich; 1:1,000); ARID2 (166117, Santa-Cruz; 1:200); BRD7 (15125, CST; 1:500); BRD9 (A303-781A, Bethyl Laboratories; 1:5,000); CTCF (3418, CST; 1:1,000); DPF2 (ab134942, Abcam); GAPDH (97166, CST; 1:2,000); Osa (AB_528420, DSHB); PBRM1 (A301-591A, Bethyl Laboratories; 1:2,000); SMARCA2 (sc-17828, Santa Cruz; 1:500); SMARCA4 (13-2002, EpiCypher; 1:5,000); SMARCB1 (91735, CST; 1:2,000); SMARCD1 (sc-135843, Santa-Cruz; 1:500); SMARCE1 (A300-810A, Bethyl Laboratories; 1:5,000); SMC3 (A300-060A, Bethyl Laboratories; 1:10,000); SMARCA5 (SNF2H) (A301-017A, Bethyl Laboratories; 1:2,000); human tubulin (T0198-25UL, Sigma Aldrich; 1:5,000); and D. melanogaster tubulin (AB_2732839, DSHB).
Protein IP
For FHD-286 treatment, cells were treated for 24 h before collection. Protein IP was performed in nuclear lysates. Nuclei were isolated from 200 × 106 cells following the ‘Nuclei Isolation for Single Cell Multiome ATAC+ Gene Expression Sequencing’ protocol (10x Genomics) with the following modifications: the cell membrane was lysed with 20 ml of the lysis buffer, followed by lysis inactivation with 30 ml of the wash buffer and then another wash in 30 ml of wash buffer. Isolated nuclei were then lysed in 4 ml lysis buffer (20 mM Tris, pH 7.5, 150 mM NaCl, 1 mM EDTA, 1 mM EGTA, 1% Triton X-100, 2.5 mM sodium pyrophosphate and 1 mM β-glycerophosphate) supplemented with protease and phosphatase inhibitors and incubated on ice for 30 min. Lysates were briefly sonicated (3 cycles of 8 s on, 30 s off; Diagenode Bioruptor Pico) and cleared by 10 min of centrifugation at 14,000g. The supernatant was incubated with an antibody (CTCF (3418, CST 4 µg), PBRM1 (A301-591A, Bethyl; 12 µg), BRD7 (A302-304A, Bethyl; 20 µg), IgG (13-0042, EpiCypher) or C15410206 (Diagenode), equal amount to the targeting antibody) overnight at 4 °C with rotation. For the experiment involving Benzonase (E1014, Millipore), 100 U of the enzyme and MgCl2 to a final concentration of 1.5 mM were added to the samples. After overnight incubation, protein A/G magnetic beads (26162, Invitrogen) were added and incubated for additional 4 h to capture target-interacting complexes. For immunoblot detection, beads were washed 3 times with the lysis buffer before elution in 2× Laemmli sample buffer and incubation in 95 °C for 5 min. For MS analyses, beads were washed 3 times with the lysis buffer, 3 times with cold PBS and frozen at −80 °C.
MS analysis
CTCF-interacting peptides, isolated from nuclear lysate by IP, were loaded on a 50 cm column (Thermo Fisher ES903) and separated by reverse-phase chromatography using a gradient from 1% to 30% buffer B over 130 min, to 90% buffer B over 5 min and held to 90% buffer B for 10 min with a flow rate of 300 nl min–1 using a Vanquish Neo system (Thermo Fisher). Buffer A was 0.1% formic acid (FA) in HPLC-grade water, buffer B was 0.1% FA in acetonitrile. The column temperature was maintained at 60 °C. MS analysis was conducted using an Orbitrap Fusion Lumos Tribrid mass spectrometer operating in data-independent acquisition mode with positive ionization. Full MS spectra were acquired in the m/z range of 380–985 at a resolution of 120,000, with standard automatic gain control (AGC) target settings and a maximum injection time of 50 ms. Targeted MS2 spectra were acquired in the m/z range of 145–1,450 using a precursor mass range of m/z 380–985, a quadrupole isolation window of 10 m/z, and 60 scan events. The MS2 scans were acquired at a resolution of 15,000 with an AGC target of 1 × 10⁵ and a maximum injection time of 40 ms. Fragmentation was performed using higher-energy collision-induced dissociation with a one-step collision energy of 30%. The electrospray voltage was maintained at a static setting, and the capillary temperature was set to 305 °C. No sheath or auxiliary gas flow was applied. IP PBRM1 samples were prepared for MS using S-Trap micro columns (ProtiFi) according to the manufacturer’s recommended protocol. Proteins were reduced using 20 mM tris((2-carboxyethyl) phosphine) for 30 min at 47 °C with gentle agitation and alkylated with 20 mM iodoacetamide for 30 min at room temperature in the dark. Then, samples were acidified with phosphoric acid at a final concentration of 1.2%. Samples were digested with 1 µg of sequencing-grade modified trypsin (Promega) for 3 h at 47 °C. Peptides were eluted sequentially with 50 mM triethylammonium bicarbonate, 0.2% FA and 0.2% FA in 50% acetonitrile. Eluted peptides were dried and resuspended in loading buffer reverse phase (0.1% FA in HPLC-grade water). The peptides were loaded on a 25 cm × 75 µm x 1.5 µm PepSep C18 HPLC column with a 10 μm CaptiveSpray emitter using a NanoElute 2 system (Bruker) with a linear gradient of 3–20% buffer B over 90 min followed by a step from 20–37% buffer B in 20 min at 150 nl min–1 and 37–95% buffer B in 10 min at 200 nl min–1 and held at 95% for 5 min. The gradient was then decreased to 5% buffer B for 5 min at 200 nl min–1. Buffer A was 0.1% FA in HPLC-grade water, buffer B was 0.1% FA in acetonitrile. The column temperature was maintained at 50 °C. The timsTOF Ultra mass spectrometer (Bruker) was operated in data-independent acquisition parallel accumulation, serial fragmentation mode, using variable-width ion mobility-m/z windows. There were no overlap windows in m/z, but ion mobility windows were acquired with varying overlaps. TIMS settings were 100 ms ramp and accumulation time (100% duty cycle) and ramp rate of 9.43 Hz; this resulted in 1.17 s of total cycle time, and mass spectra were recorded in the m/z range of 300–1,470 for the bulk samples, whereas 0.95 s of total cycle time and mass spectra were recorded in the m/z range of 400–1,000. Collision energy was applied in a linear fashion, with an ion mobility of 0.6–1.6 V s cm–2 and collision energy from 20 eV to 59 eV.
Proliferation assay
Cell proliferation was assessed using a CellTiter-Glo Luminescent Cell Viability assay (G7572, Promega) over a period of 5 days according to the manufacturer’s manual. Cells were seeded in 384-well plates with transparent bottom at a density of 4,000 cells per well for suspension cells (RIVA) and 500 and 1,500 cells for adherent cells (MEFs) in 50 μl of appropriate culture medium. Luciferase-containing lysis buffer was added to a portion of cells for luminescence measurement at the time of seeding and then every 24 h using a BioTek Synergy Neo plate reader (Agilent). Background luminescence from cell-free wells was subtracted from all readings. The relative luminescence intensity, which correlates to ATP levels and viable cell number, was normalized to 0 h values and expressed as the fold change over time. Three to six technical replicates were measured for each time point for each cell line.
Bulk RNA-seq
Expression levels of genes encoding CTCF and cohesin subunits and PBAF subunits were assessed by bulk RNA-seq. RNA was isolated from non-treated RIVA cells using a RNeasy Mini kit (74104, Qiagen) according to the manufacturer’s manual. RNA samples were submitted to The Weill Cornell Genomics Resources Core Facility for RNA-seq library preparation, followed by sequencing with a NovaSeq 6000 System.
Bulk ATAC–seq
Experiments were performed in biological triplicate for each condition. When three independent clones were not available, three parallel cultures of the same cell line were maintained separately for at least 7 days before the experiment. This approach ensured that replicates were derived from independently propagated cell populations rather than representing technical replicates. Cells were passaged 24 h before the procedure to ensure logarithmic growth at the time of the experiment. For ATAC–seq following pharmacological treatment, cultures were passaged again after 24 h and split in two, with one fraction treated with a drug, whereas the other received an equivalent volume of DMSO as a control. In the case of ATAC–seq after treatment, after 24 h, the culture was split into two, and one part received a drug and the other DMSO, followed by 24 h of treatment before the experiment. Cells were incubated for 24 h before ATAC–seq analyses. For ATAC–seq of mouse primary cells, freshly sorted cells were isolated from mouse spleens and processed immediately. The procedure followed the Omni-ATAC protocol92. In brief, 75,000 live cells were rinsed in cold PBS and lysed in 50 μl cold lysis buffer (10 mM Tris-HCl, pH 7.5, 10 mM NaCl, 3 mM MgCl2, 0.1% NP-40, 0.1% Tween-20 and 0.01% Digitonin) for 5 min on ice. Next, 1 ml wash buffer (10 mM Tris-HCl, pH 7.5, 10 mM NaCl, 3 mM MgCl2 and 0.1% Tween-20) was added, and the samples were centrifuged. The pelleted nuclei were then resuspended in a transposition reaction mix that was prepared using Illumina Tagment DNA TDE1 Enzyme and Buffer kits (Illumina 20034197) and incubated at 37 °C for 30 min on a thermomixer set at 1,000 rpm. Tagged DNA fragments were purified using a Clean & Concentrator-5 kit (Zymo D4014) and then subjected to PCR amplification to generate sequencing libraries. PCR amplicons were purified using a Clean & Concentrator-5 kit (Zymo D4014). The size distribution and quality of the library were evaluated using a High Sensitivity DNA kit (Agilent 5067-4626) and run on an Agilent 2100 Bioanalyzer. The libraries were sequenced on Illumina NovaSeq 6000 and NovaSeq X Plus platforms using a PE50 SP kit.
ChIP–seq
ChIP–seq was carried out as previously described24 with slight modifications. Changes to the protocol were as follows: (1) hES cells were double-fixed with 2 mM DSG (Sigma 80424-5MG-F) for 50 min, followed by 1% formaldehyde at room temperature for 10 min; (2) double-fixed mES cells were added to each hES cell sample in equal amount as a spike-in control before cell lysis; (3) the number of chromatin sonication cycles was adjusted per experiment to maintain consistent shearing pattern, ranging from 10 to 26 cycles of 30 s of sonication in Diagenode Bioruptor Pico, with 30 s of breaks in between cycles; and (4) DNA was purified using chloroform–phenol extraction. Immunoprecipitated DNA and input DNA were subject to library preparation (NEBNext Ultra II DNA Library Prep kit, Illumina). The following antibodies were used: ARID1A (ab182560, Abcam), BRD7 (A302304AT, Bethyl Laboratories), CTCF (91285, Active Motif), DPF2 (ab134942, Abcam), HA (3724, CST), H3K4me1 (ab8895, Abcam), PBRM1 (A301-591A, Bethyl Laboratories) and SMC3 (5696, CST, for RIVA and SUM159 cells, ab9263, Abcam, for hES cells). Libraries for next-generation sequencing were prepared using a NEBNext Ultra II DNA Library Prep kit for Illumina (New England Biolabs, E7645L) with dual indexes (E6440, NEB). Purification of DNA was carried out using AMPure XP beads (NC9933872, Thermo Fisher Scientific). The concentration was measured using a Qubit Fluorometer (Thermo Fisher) with a dsDNA High Sensitivity kit (Q32851), and the size of DNA fragments was assessed with a High Sensitivity DNA kit (Agilent 5067-4626) on an Agilent 2100 Bioanalyzer. The libraries were sequenced on Illumina NovaSeq 6000 and NovaSeq X Plus platforms using a PE50 SP kit with minimum 20 million reads per sample.
Micro-C
Micro-C libraries were prepared following a published protocol51,93 with minor modifications. First, the dinucleosome band was size-selected using an E-gel EX 2% agarose (A42135, Invitrogen) after DNA purification. Second, the end-repair step using the Lucigen End-It DNA End-Repair kit (now discontinued) was omitted. Adjustments were applied to two experimental setups: (1) RIVA WT and ARID1AHet and (2) RIVA WT, ARID1AHet and ARID1AHetARID2Hom, as detailed below.
In brief, 30 × 106 RIVA cells were crosslinked with 1% formaldehyde for 10 min at room temperature, followed by quenching with 750 mM Tris-HCl (pH 7.4). Fixed cells were washed with PBS, further crosslinked with 3 mM DSG for 45 min, quenched with 750 mM Tris-HCl and washed again. The doubly crosslinked cells were counted and pelleted in 1 × 10⁶ aliquots and flash-frozen and stored at −80 °C until proceeding further.
Micrococcal nuclease (MNase, NEB M0247S) digestion was determined by titration to achieve an 80:20 to 90:10 mononucleosome to dinucleosome ratio. Cells were resuspended in MB1 buffer (10 mM Tris-HCl pH 7.5, 50 mM NaCl, 5 mM MgCl2, 1 mM CaCl2 and 0.2% NP-40) supplemented with protease inhibitor cocktail and 1× PMSF and digested with the MNase amount pre-optimized for each batch (3.25 μl NEB MNase M0247S for experiment (1) and 0.2 μl for experiment (2)) at 37 °C for 10 min. Digestion was stopped by adding 0.8 mM EGTA and heating to 65 °C for 10 min. The nuclei were then washed with MB2 buffer (10 mM Tris-HCl pH 7.5, 50 mM NaCl and 10 mM MgCl2).
The DNA ends were repaired with T4 PNK (M0201, NEB) and filled in with biotinylated nucleotides (biotin-14-dATP;NU-835-BIO14-L and biotin-11-dCTP;NU-809-BIOX-L, Jena Biosciences) using Klenow (large fragment) DNA polymerase (M0210, NEB). Proximity ligation was performed at 25 °C for 2.5 h for experiment (1) and overnight for experiment (2) using T4 DNA ligase (M0202S, NEB), followed by exonuclease III (M0206, NEB) treatment to remove unligated biotinylated ends. Crosslink reversal, RNase A and proteinase K treatment were performed in a single step at 65 °C overnight for experiment (1) and for 9 h for experiment (2), followed by DNA purification using phenol–chloroform–isoamyl alcohol extraction. The aqueous phase was further processed using a Zymo Clean & Concentrate 5 kit (D4014, Zymo) and eluted in 20 µl TE buffer.
Purified DNA was separated on an E-gel EX 2% agarose (A42135, Invitrogen), and the di-nucleosome band (around 250–400 bp) was excised and extracted using a Zymo Gel DNA Recovery kit (D4001). For library preparation, the DNA was bound to MyOne Streptavidin C1 beads (65001, Invitrogen), washed with TBW (10 mM Tris-HCl pH 7.5, 1 M NaCl, 0.5 mM EDTA and 0.1% (v/v) Tween-20) and processed using a NEB Ultra II DNA Library Prep kit (E7645L). Libraries were amplified with ten PCR cycles, quantified via BioAnalyzer and Tapestation, then sequenced on a NovaSeq X Plus platform using a PE150 SP kit to achieve at least 420 million reads per sample.
Bone marrow transplantation
Bone marrow cells were collected from the femur and tibia of donor mice aged between 8 and 12 weeks, followed by treatment with a red blood cell lysis solution (Qiagen 158904). Lethally irradiated C57BL/6J host mice, who received two doses of 450 RAD via a Rad Source Technologies RS 2000 Biological Research X-ray Irradiator, were then injected with 1 million of these cells through the retro-orbital sinus. These transplanted mice were used for experiments 8–16 weeks after transplantation. Excluding the mice euthanized at predetermined intervals, all mice participating in lymphomagenesis research were observed until they exhibited one or more conditions warranting euthanasia. These conditions included significant lethargy and body weight loss as well as discernible splenomegaly. This procedure aligns with the guidelines of our animal protocol approved by the Weill Cornell Medicine Institutional Animal Care and Use Committee (protocols 2011-0031 and 2025-0008, PI: Barisic).
Immunization
To induce germinal centre (GC) formation in the spleens, mice were immunized with an intraperitoneal injection of 500 μl of 2% sheep red blood cells resuspended in sterile 1× DPBS, prepared from a solution of sheep blood in Alsever’s (Cocalico Biologicals 20-1334A). Alternatively, mice were immunized via intraperitoneal injection with 80 μg NP(30-32)-KLH (Biosearch Technologies N-5060) adsorbed in alum adjuvant (ThermoFisher 77161) at a 1:1 ratio of alum to immunogen before injection.
Flow cytometry of GC B cells
Spleens were homogenized, and splenocytes were filtered through a 40 μm cell strainer, followed by enrichment of mononuclear cells using density gradient centrifugation with Ficoll–Paque Premium (Cytiva 17-5442-02). The resulting single-cell suspensions were resuspended in PBE (PBS with EDTA) containing 0.5 μg ml–1 rat anti-mouse CD16/CD32 (clone 2.4G2, BD) and incubated for at least 5 min on ice to block Fc receptors. Without washing, cells were stained for 20 min on ice with a mix of fluorochrome-conjugated anti-mouse antibodies, either diluted in PBE or in a 50:50 mix of Brilliant stain buffer (BD 566349) and PBS with 0.5% BSA (without EDTA), when the mix included ≥2 BV-conjugated or BUV-conjugated antibodies, to prevent staining artefacts caused by dye interactions. The cells were washed twice before analysis. DAPI (ThermoFisher D1306) was added immediately before acquisition at a final concentration of 0.5 μg ml–1 to exclude dead cells. Data were acquired on a BD Symphony A3 and analysed using FlowJo software. The following antibodies and dilutions were used: B220-APC (clone RA3-6B2, BD 553092; 1:100); B220-BV786 (clone RA3-6B2, BD 563894; 1:300); CD138-BUV737 (clone 281-2, BD 564430 and BD 624230; 1:500), CCR6-PerCP-Cy5.5 (clone 29-2L17, BioLegend 129809; 1:300); CD11b-APC (clone M1/70, BioLegend 101212; 1:400); CD21-APC (clone 7E9, BioLegend 123412; 1:500); CD21-PECy7 (clone 7E9, BioLegend 123420; 1:500); CD4-BUV563 (clone GK1.5, BD 612923; 1:500); CD38-BUV395 (clone 90, BD 740245; 1:500), CD38-BUV563 (clone 90/CD38, BD 741271; 1:400); CD80-BV421 (clone 16-10A1, BioLegend 104725; 1:300); CD86-BV605 (clone GL-1, BioLegend 105037; 1:200); CXCR4-biotin (BD 551968; 1:200); CXCR4-PE (clone 2B11,Invitrogen 12-9991-82; 1:100); ephrin-B1-biotin (R&D Systems, BAF473; 1:100); FAS-BUV805 (clone Jo2, BD 741968; 1:100); FAS-PE-Cy7 (clone Jo2, BD 557653; 1:500); GL7-FITC (BD 553666; 1:500); GL7-PerCPCy5.5 (clone GL7, BioLegend 144610; 1:500); IgD-BV510 (clone 11-26c.2a, BD 563110; 1:500); IgD-PerCP (clone 11-26c.2a, BioLegend 405709; 1:500); IgG1-BV650 (clone A85-1, BD 740478; 1:500); IgM-BUV661 (clone II/41, BD 750660; 1:300); IgM-BUV805 (clone II/41, BD 749307; 1:500); kappa-APC-Cy7 (1:200), lambda-BV421 (1:400); and PD-L2-BUV395 (clone TY25, BD 565102; 1:75). The following secondary antibodies were used: SA-APC-Cy7 (BioLegend 405208; 1:100) and SA-BV605 (BioLegend 405229; 1:200). NP-PE (N-5070-1) was diluted to 5 µg ml–1.
Multiome single cell RNA-seq and ATAC–seq
Single-cell RNA-seq and single-cell ATAC–seq libraries were prepared using 10x Genomics Single Cell Multiome assay kits (10x Genomics; 1000230, 1000283, 1000494, 1000215 and 1000212) following the manufacturer’s guidelines. In brief, GC cells from splenocytes were sorted using antibody cocktails described above (Flow Cytometry), rinsed with 0.04% BSA PBS, and 100,000 cells underwent the manufacturer’s nucleus preparation procedure and a combination of regular and low-input protocol was used. About 20,000 nuclei were placed into a 10x Chromium X instrument. The remainder of the library preparation steps were conducted in accordance with the manufacturer’s protocol. Libraries were evaluated using an Agilent Bioanalyzer, quantified using a KAPA Library Quantification kit and sequenced on an Illumina Novaseq platform.
Density sedimentation analysis by glycerol gradient ultracentrifugation
In brief, 180 × 106 cells were subject to nucleus isolation by lysis in buffer containing 25 mM HEPES (pH 7.6), 25 mM KCl, 0.05 mM EDTA, 10% glycerol, 5 mM MgCl2, 0.1% NP-40, supplemented with 1 mM DTT, protease inhibitors and 1 mM PMSF on ice, following a 15-min centrifugation at 1,000g and 4 °C. The nuclei were resuspended in a buffer containing 10 mM HEPES (pH 7.6), 3 mM MgCl2, 100 mM KCl, 0.1 mM EDTA, 10% glycerol supplemented with 1 mM DTT and protease inhibitor, and lysed by the addition of ammonium sulfate to final concentration of 0.3 M. Proteins are separated from chromatin through ultracentrifugation at 4 °C, 150,000g for 30 min and precipitated in 0.3 g ml–1 ammonium sulfate for 20 min on ice. After another ultracentrifugation at 4 °C, 100,000g for 20 min, the nuclear lysate was resuspended in HEM buffer containing 25 mM HEPES (pH 7.9), 0.1 mM EDTA, 12.5 mM MgCl2 and 100 mM KCl, supplemented with 1 mM DTT and 1 mM PMSF. The protein concentration was assessed using a Bradford assay (5000205, Bio-Rad). Samples were diluted to 800 μg of proteins in 300 μl HEM buffer. The lysates were then carefully overlaid onto 7 ml of 10–30% glycerol gradient (diluted with HEM buffer), prepared in a 14 × 89 mm polyallomer centrifuge tube (331372, Beckman). Tubes were placed in a SW-40 swing bucket rotor and centrifuged at 4 °C for 16 h at 40,000 rpm in Beckman Optima XPN-100 ultracentrifuge. For SUM159, 21 fractions of 0.4 ml were collected. For RIVA, 6 fractions of 0.5 ml were collected, followed by 29 fractions of 0.2 ml. The proteins were precipitated with resin, 1/10 volume of each sample. The concentrated protein fractions were subsequently used in immunoblot analyses.
Computational analyses
Bulk ATAC–seq analysis
Raw sequencing reads were assessed using FastQC. Sequence adapters were removed with Trim Galore!, and the cleaned reads were aligned to either the mm10, hg38 or dm6 genome reference using BWA. Duplicate reads were identified with Picard94. Post-alignment, mitochondrial reads, duplicates, reads from blacklisted regions, secondary alignments, multimapping reads, reads with insert sizes greater than 2 kb, incorrectly oriented paired reads or orphan reads were removed. Peak calling was performed with MACS2 using a shift of −75 bp and an extension of 150 bp95. ATAC–seq quality control was done by evaluating fragment length distribution, FRIP scores, transcription start site (TSS) enrichment and high-quality autosomal reads with Picard, ataqv and MultiQC96,97. Consensus peaks were determined by overlapping regions covered in at least two samples. FeatureCounts was used to quantify reads in the peaks98. Data normalization for visualizations and unsupervised clustering was done using variance stabilizing transformation (vst)99. Differential peak accessibility was analysed using DESeq2 with a negative binomial model, filtering for an absolute fold change of 1.5 (log2[fold change] of 0.58) and an FDR-adjusted P value of 0.01. Peaks were annotated by identifying the most significantly changing peak within 5 kb of the TSS of each gene and assigning it to the promoter or potential enhancers of the gene, as defined by GREAT100. Genes were ranked by log2 fold change or the Wald statistic and analysed using GSEA with the MSigDB database and curated gene signatures from RNA-seq and literature101,102, filtering for adjusted P values less than 0.05. Transcription factor regulatory potential was evaluated by comparing mammalian motifs in JASPAR to sequences of accessible peaks103,104. A multivariate model was used to assess the relationship between log2 fold changes in peak accessibility and motif presence, adjusting for GC content, that is, log2[fold change = β0 + β1 × x1 + β2 × x2 + … + βN × GC, where xi is a Boolean variable for the presence of a TF motif in a peak as a binary variable and GC for the GC-content of the peak. Effect sizes and P values were derived using ordinary least squares regression with robust standard errors. Furthermore, TF-binding sites, binding scores and differential binding were analysed using TOBIAS footprinting105. Pseudomedians and 95% CI were calculated using the wilcox.test() function in R (v.4.3.1). Read density heatmaps were generated from normalized bigwig files using deepTools (v.3.5.5). Enrichment of CTCF knockout rescued and not rescued genes was performed using the hypergeometric distribution test and a curated list of CTCF-related signatures. The diversity of ATAC–seq response following FHD-286 treatment was assessed using interquartile range (IQR) of the DESeq2 log2 fold change at opening or closing (mean absolute fold change > 1.1 across all cell lines) peaks. CTCF motif overlap was determined using predicted CTCF motif sites from the JASPAR motif set, accessed through AnnotationHub record AH104727.
ChIP–seq analysis
Raw read quality control and adapter trimming were conducted using FastQC and TrimGalore!, followed by alignment of the reads to the hg38 genome reference with BWA106,107,108. Duplicate reads were identified using Picard94. After alignment, duplicate reads, reads in blacklisted regions, secondary alignments, multimapping reads, reads with an insert size over 2 kb, misoriented pairs or orphan reads were removed. Peaks were called for each IP sample compared with control samples using MACS2 (ref. 95). Consensus peaks were called as taking union of all the peaks. Peak calls were filtered to retain peaks present in at least two or three replicates, depending on the total number of samples in the experiment, with the required number not exceeding the number of replicates per condition minus one. Reads in peaks were quantified using FeatureCounts, and differential binding and annotation steps were performed similar to the ATAC–seq methods described above using DESeq2. In datasets with large copy-number differences between groups, CNVkit109 segment relative copy numbers were assigned to peaks, combined with DESeq2 library-size factors, and normalized using the DESeq2 normalizationFactors() function. Targets that had ChIP–seq experiments across multiple batches in the same conditions had their replicates combined when appropriate. Batch correction was performed using raw peak counts with a batch covariate in the negative binomial model of DESeq2, and plotting was performed using batch correction on the variance-stabilizing-transformed values using limma or on counts using ComBat-seq. ChIP–seq coverage was calculated using the bamCoverage function of the deeptools framework (v.3.5.5), using RPGC normalization where indicated and 10 bp bins. log2 fold change bigwigs were determined using the bigwigCompare function with pseudocount=1. Read density heat maps were prepared using the computeMatrix and plotHeatmap functions. PCA for all ChIP datasets generated in this study are shown in Supplementary Fig. 4b.
Multiome analysis
Multiome fastq files were aligned and processed using CellRanger Arc (v.2.0.0; 10x Genomics). The resulting outputs were further processed with Signac (v.1.5.0)110. Peaks were called using MACS2 with default settings95. A combined peak set was created from all samples, with peaks larger than 10 kb or smaller than 20 bases being filtered out. To correct for batch effects between experiments, Harmony (v.0.1.0) was applied on PCA (RNA) and LSI (ATAC) data111. Harmony-corrected values were used with Signac’s FindMultiModalNeighbors to generate multimodal nearest neighbours, which were used for UMAP visualization. Cell-type labels were assigned using RNA expression and the Seurat TransferLabel function with reference datasets70. Gene signature module scores were calculated using the AddModuleScore function with a control value of 5. Slingshot (v.2.8.0) was used to generate pseudotime, based on the first and second Harmony-corrected PCA of expression, starting from Centroblasts. The density and difference in density of cells for WT and ARID1AHet cells along pseudotime were calculated, with significance assessed using the Wilcoxon rank-sum test. ChromVAR scores for the JASPAR2020 core vertebrate motif list were calculated using Signac’s AddMotif and RunChromVAR functions on the filtered, combined peak set. Gene signature or ChromVAR accessibility of specific motifs were plotted against pseudotime, divided into ten deciles. Expression or accessibility for each decile was compared between WT and the indicated genotype using Wilcoxon rank-sum tests, and the differences in splines were plotted and coloured according to decile significance. Signac LinkPeaks was used to identify putative promoter–enhancer loops using the default settings, including a maximum distance of 500 kb for all genes. The multiome processing code can be accessed at GitHub (https://github.com/crchin/multiome_process).
Bulk RNA-seq analysis
Raw sequencing reads were processed using the nf-core/rnaseq pipeline112 (v.3.12.0) with default parameters. In the pipeline, Salmon (v.1.10.1) was used in quasi-mapping mode for transcript-level quantification against the GRCh38 human reference transcriptome (GENCODE v.33 annotation). Transcript abundances were imported into R and summarized to gene-level counts using the tximport package. Differential expression analysis was performed using DESeq2 (v.1.38.3). Genes encoding PBAF-specific subunits, as well as CTCF and cohesin subunits, were selected for targeted analysis. Count data were normalized using variance stabilizing transformation for plotting.
Micro-C analysis
Paired-end reads, obtained in biological duplicates for WT and ARID1AHet cells, were converted to valid pairs files and cool files following Dovetail’s Micro-C analysis protocol. The paired-end reads were aligned to the human genome (hg38) using BWA-MEM (v.0.7.18) with the following parameters: −5SP -T0. High-quality, valid pairs were retained using the parse module from the pairtools (v.0.3.0) implementing the following parameters: –min-mapq 40 –walks-policy 5unique –max-inter-align-gap 30. After the resulting pairsam file was sorted using pairtools sort, PCR duplicates were removed using the dedup module from pairtools with the following parameters: -mark-dups -output-stats. The pairtools split module was then used to generate a .bam and .pairs file. This process was performed individually on biological replicates and pooled replicates. Using the pairs file, two contact matrix file formats were generated: .cool and .hic. The .cool files were generated using cooler cload pairix (v.0.9.3) and KR-normalized using cooler zoomify –balance at 1 kb, 5 kb, 10 kb, 20 kb and 100 kb resolutions. The .hic files were generated using juicer tools (v.1.22.01) and KR-normalized at 10 kb and 20 kb resolutions. To ensure robust cross-condition comparisons and to remove systematic biases arising from sequencing depth, coverage heterogeneity and distance-dependence decay, we also jointly normalized replicate contact pairs for each genotype binned at 10 kb resolution using the fast loess procedure implemented in MultiHiCcompare (v.1.24.0). These fast-loess-normalized matrices were converted to .cool files. TADs were called using HiTAD (v.0.4.5) on 20 kb cool matrices and filtered to retain levels 0 and 1. Differential TAD domains were called using DiffDomain (v.1.0.0) on filtered HiTAD output. Insulation scores were obtained using the hicFindTADs tool from HiCExplorer (v.3.7.2) that were then mapped to boundaries from HiTAD TADs. Inter-TAD and intra-TAD connectivity across TAD boundaries was calculated using HiTAD output with the HiCExplorer hicInterIntraTAD function. Aggregate TAD plots were generated with the ATA function from the R package GENOVA (v.1.0.1) using 10 kb resolution loess-normalized matrices. GENOVA was also used to visualize contact matrices and differentials between WT and ARID1AHet data and to calculate relative contact probabilities. Loops were called using Mustache (v.1.0.1) on 5 kb KR-normalized .hic matrices per replicate. Pooled loops were obtained by the union of replicate loops. Loops were filtered using a P value threshold of 0.1 and a sparsity threshold of <0.6. To determine coordination of histone marks and gene expression in differential TAD domains, ChIP–seq mark summed densities were mapped to TAD domain regions, whereas gene expression was obtained from genes for which promoters overlapped with TAD domains. The coordination score was defined as previously described54. TAD boundary pile-ups were calculated using the union of TAD boundaries across the genotypes, and comparing the pile-ups to randomized shifted control regions using the shift option of coolpup.py.
Analysis of IP–MS data
Raw (.d) files were searched using the FragPipe computational platform (v.20.0) with the DIA-NN search engine (v.1.8.2_beta_8) against the UniProt Homo sapiens (UP000005640) database (reviewed sequences and isoforms; downloaded on 7 November 2023) using the BRUKER Human trypsin TIMScore (v.2) spectral library with a 1% FDR and default settings. A contaminant FASTA from the L. Hao Laboratory113 was included. The spectral library contains 13,114 protein groups and 573,437 precursor ions. Intensity data were log2-transformed and filtered to contain entries with at least two unique peptides and a minimum of 33.3% valid values in one group for comparisons. Missing values were imputed by random numbers drawn from a normal distribution, shifted down by 1.8 s.d. and with a width of 0.3 of each sample, using Perseus (v.2.0.11.0). Statistical analysis was performed using the R package Limma (v.3.60.3), applying an adjusted P value threshold (FDR-adjusted P < 0.05) to control for the FDR. Protein enrichment was determined relative to IgG control IPs.
Analyses of gene expression datasets
Gene expression data for normal tissue were retrieved from the Human Protein Atlas (HPA) on 26 July 2024. RNA expression was extracted from the single-cell RNA expression dataset (rna_single_cell_type.tsv) and grouped according to the cell-type classification from the HPA (rna_single_cell_type_cell_types.tsv), with groups containing fewer than three representative cell types excluded. Expression data were visualized by sorting cell-type groups based on median normalized TPM (nTPM) values. Gene expression data for human cancer cell lines was obtained from the DepMap Public 24Q4 dataset (accessed 26 July 2024). Expression values were log-transformed (log2[TPM + 1]) and merged with model metadata using ‘Cell Line Name’ as the common identifier. Lineages with fewer than three cell lines were removed, and median expression values were used to order cancer types. Gene expression data from human cancer cell lines were also retrieved from the HPA. Cell line information was extracted from the cell line dataset (rna_cell_lines.tsv), which was filtered to include only malignant cell lines. RNA expression data were extracted from the RNA gene expression dataset (rna_celline.tsv) and merged with the cell line dataset through the ‘Cell line’ identifier. Last, only rows corresponding to the gene of interest (CTCF) were retained. Cancer types with fewer than three representative cell lines were excluded, and nTPM values were summarized by median expression per disease type. All analyses were performed in Python (v.3.10) using pandas, seaborn and matplotlib.
For the DepMap dataset, the following violin sample sizes were used: lymphoid, n = 166; muscle, n = 5; nervous system, n = 40; myeloid, n = 62; bone, n = 43; bladder and urinary tract, n = 37; lung, n = 204; oesophagus and stomach, n = 73; uterus, n = 40; cervix, n = 20; CNS and brain, n = 97; bowel, n = 80; breast, n = 67; ampulla of Vater, n = 4; soft tissue, n = 56; liver, n = 27; pancreas, n = 54; prostate, n = 12; pleura, n = 22; skin, n = 95; ovary and fallopian tube, n = 67; kidney, n = 46; thyroid, n = 16; biliary tract, n = 42; testis, n = 6; head and neck, n = 65; eye, n = 19; and fibroblast, n = 39.
For the HPA datasets, sample sizes of normal cells were as follows: blood and immune cells, n = 12; squamous epithelial cells, n = 4; trophoblast cells, n = 3; muscle cells, n = 3; mesenchymal cells, n = 4; glandular epithelial cells, n = 18; specialized epithelial cells, n = 11; neuronal cells, n = 6; glial cells, n = 6; endocrine cells, n = 3; and germ cells, n = 5.
For malignant cells, the following sample sizes were used: lymphoma, n = 76; leukaemia, n = 93; neuroblastoma, n = 17; myeloma, n = 34; cervical cancer, n = 8; bone cancer, n = 21; bladder cancer, n = 26; gastric cancer, n = 42; rhabdoid, n = 14; colorectal cancer, n = 63; breast cancer, n = 62; pancreatic cancer, n = 46; sarcoma, n = 15; lung cancer, n = 232; oesophageal cancer, n = 27; prostate cancer, n = 8; liver cancer, n = 24; bile duct cancer, n = 7; ovarian cancer, n = 59; brain cancer, n = 80; uterine cancer, n = 29; skin cancer, n = 62; head and neck cancer, n = 38; thyroid cancer, n = 11; and kidney cancer, n = 35.
Multimark chromatin segmentation and clustering analysis
The chromatin segmentation, quantification and clustering steps were completed as previously described24. In brief, a common peak set was generated from the input marks (ATAC–seq, CTCF ChIP–seq and PBRM1 ChIP–seq). Peaks were extended to a minimum size of 500 bp and a graph was generated in which each vertex is a peak and two vertices are connected only when the two peaks overlap by >50% of their size in both directions. The graph was split into connected components, and components were collapsed into regions by taking the maximal extent of the peaks in that component. Any unconnected peaks were added to this set by their original coordinates. The start and end coordinates of all the regions were concatenated and taken as a set of boundary coordinates, and the genome was segmented into disjoint regions between these boundaries to make up the candidate segmentation set. The original peaks across all the marks and replicates were overlapped with this candidate set. Any region with fewer than two overlaps were discarded. Any adjacent region with similar peak presence or absence values (as a Hamming distance of binary values less than 2) were combined into one. After the peaks were segmented into these regions, subread featureCounts98 was used to quantify the reads of every mark across all the datasets. Normalized log-FPKM scores were calculated for each file, and the replicates were collapsed in a dataset by taking the median per region, and the log2 fold change of the differential (ARID1AHet versus WT) was calculated by taking the log-FPKM difference between the conditions. The normalized score for the WT conditions and the log2 fold change scores were clustered using k-means clustering using the input feature set used during peak segmentation, and the rest were used as independent read-outs. Gene expression was associated to the regions by taking the nearest TSS to each region and taking the expression difference. CTCF motifs were annotated using the CTCF R package and the EMBL M1 and M2 motifs114,115. For Supplementary Fig. 11, the motif enrichment was calculated taking the peaks in each cluster and assigning them a dependent variable of 1, and any other peak outside of that region as 0, and running the multivariate motif enrichment as described in the ATAC–seq section. The TAD insulation scores were calculated by taking the insulation scores around 100 kb of each region from Micro-C results with a 10 kb bin size, and shifting each profile vertically so that the maximal insulation score of each peak is shifted to zero. Therefore the insulation score difference between ARID1AHet and WT data would be calculated as the delta of the trough at the centre of the region (if any) compared with the background connectivity for each condition, and the differences in the extents of the dips can be calculated between ARID1AHet and WT.
Survival data analysis
Overall survival was calculated and graphically represented using cBioPortal (www.cbioportal.org) (PMID: 22588877). Studies included in the analysis are part of TCGA study (PMID: 24071849). Kaplan–Meier plots were cut once only one patient was left in one of the groups. Significance was determined by performing log-rank tests.
Quantification and statistical analyses
Statistical parameters such as the number of replicates (n), precision measures (mean or median ± s.d.) and significance are provided in the figures and figure legends. Results were considered significant if P < 0.05 or adjusted P < 0.05 according to the specified test. Statistical analyses were conducted using R (v.4.1.0) and Prism GraphPad (v.10.0). Details of the statistical analysis for sequencing data are outlined in the Methods and figure legends.
Inclusion and ethics statement
All animal studies were approved by the Institutional Animal Care and Use Committee of Weill Cornell Medicine under protocols 2011-0031 (PI: D.B.) and 2025-0008 (PI: D.B.), and conducted in compliance with institutional guidelines and the Guide for the Care and Use of Laboratory Animals. Both male and female mice were used in all experiments, with age-matched and sex-matched cohorts, and no sex-based differences were observed. All hES cell research was approved by the Weill Cornell ESCRO committee (protocol 2022-05-001). No human participants or identifiable human data were used.
Biological materials
All commercially available and previously published materials used in this study are referenced in the text. Unique biological materials generated in this study, including ARID1A-mutated lymphoma cell lines and Arid1aflox/floxCtcfflox/floxCg1Cre double conditional deletion mice, are available from the corresponding authors upon reasonable request and may be subject to a Material Transfer Agreement.
Reporting summary
Further information on research design is available in the Nature Portfolio Reporting Summary linked to this article.
Data availability
All sequencing data generated in this study, including ATAC–seq, ChIP–seq, Micro-C and single-cell multiome datasets, have been deposited into the Gene Expression Omnibus under accession code GSE294051 and GSE237990. There are no restrictions on data availability. No human participants or identifiable human data were used. Source data are provided with this paper.
Code availability
The multiome processing code can be accessed at GitHub (https://github.com/crchin/multiome_process). The ATAC–seq TF regulatory potential and multimark chromatin model code can be found at GitHub (https://github.com/meydan-lab/Nature_2026_BAF_CTCF).
References
Clapier, C. R., Iwasa, J., Cairns, B. R. & Peterson, C. L. Mechanisms of action and regulation of ATP-dependent chromatin-remodelling complexes. Nat. Rev. Mol. Cell Biol. 18, 407–422 (2017).
He, S. et al. Structure of nucleosome-bound human BAF complex. Science 367, 875–881 (2020).
Gourisankar, S., Krokhotin, A., Wenderski, W. & Crabtree, G. R. Context-specific functions of chromatin remodellers in development and disease. Nat. Rev. Genet. 25, 340–361 (2024).
Kadoch, C. & Crabtree, G. R. Mammalian SWI/SNF chromatin remodeling complexes and cancer: mechanistic insights gained from human genomics. Sci. Adv. 1, e1500447 (2015).
Shain, A. H. & Pollack, J. R. The spectrum of SWI/SNF mutations, ubiquitous in human cancers. PLoS ONE 8, e55119 (2013).
Kadoch, C. et al. Proteomic and bioinformatic analysis of mammalian SWI/SNF complexes identifies extensive roles in human malignancy. Nat. Genet. 45, 592–601 (2013).
Wilson, B. G. & Roberts, C. W. M. SWI/SNF nucleosome remodellers and cancer. Nat. Rev. Cancer 11, 481–492 (2011).
Gatchalian, J. et al. A non-canonical BRD9-containing BAF chromatin remodeling complex regulates naive pluripotency in mouse embryonic stem cells. Nat. Commun. 9, 5139 (2018).
Guo, A. et al. cBAF complex components and MYC cooperate early in CD8+ T cell fate. Nature 607, 135–141 (2022).
Hakimi, A. A. et al. A pan-cancer analysis of PBAF complex mutations and their association with immunotherapy response. Nat. Commun. 11, 4168 (2020).
Hodges, C., Kirkland, J. G. & Crabtree, G. R. The many roles of BAF (mSWI/SNF) and PBAF complexes in cancer. Cold Spring Harbor Persp. Med. 6, a026930 (2016).
Mittal, P. & Roberts, C. W. M. The SWI/SNF complex in cancer—biology, biomarkers and therapy. Nat. Rev. Clin. Oncol. 17, 435–448 (2020).
Wang, X. et al. SMARCB1-mediated SWI/SNF complex function is essential for enhancer regulation. Nat. Genet. 49, 289–295 (2017).
Magaña-Acosta, M. & Valadez-Graham, V. Chromatin remodelers in the 3D nuclear compartment. Front. Genet. 11, 600615 (2020).
Giles, K. A. et al. Integrated epigenomic analysis stratifies chromatin remodellers into distinct functional groups. Epigenetics Chromatin 12, 12 (2019).
Wiechens, N. et al. The chromatin remodelling enzymes SNF2H and SNF2L position nucleosomes adjacent to CTCF and other transcription factors. PLoS Genet. 12, e1005940 (2016).
McArthur, E. & Capra, J. A. Topologically associating domain boundaries that are stable across diverse cell types are evolutionarily constrained and enriched for heritability. Am. J. Hum. Genet. 108, 269–283 (2021).
Nora, E. P. et al. Targeted degradation of CTCF decouples local insulation of chromosome domains from genomic compartmentalization. Cell 169, 930–944 (2017).
Rajderkar, S. et al. Topologically associating domain boundaries are required for normal genome function. Commun. Biol. 6, 435 (2023).
Beagan, J. A. & Phillips-Cremins, J. E. On the existence and functionality of topologically associating domains. Nat. Genet. 52, 8–16 (2020).
Barisic, D., Stadler, M. B., Iurlaro, M. & Schübeler, D. Mammalian ISWI and SWI/SNF selectively mediate binding of distinct transcription factors. Nature 569, 136–140 (2019).
Corona, D. F. V. & Tamkun, J. W. Multiple roles for ISWI in transcription, chromosome organization and DNA replication. Biochim. Biophys. Acta 1677, 113–119 (2004).
Iurlaro, M. et al. Systematic assessment of ISWI subunits shows that NURF creates local accessibility for CTCF. Nat. Genet. 56, 1203–1212 (2024).
Barisic, D. et al. ARID1A orchestrates SWI/SNF-mediated sequential binding of transcription factors with ARID1A loss driving pre-memory B cell fate and lymphomagenesis. Cancer Cell 42, 583–604 (2024).
Fiskus, W. et al. BRG1/BRM inhibitor targets AML stem cells and exerts superior preclinical efficacy combined with BET or menin inhibitor. Blood 143, 2059–2072 (2024).
de Miguel, F. J. et al. Mammalian SWI/SNF chromatin remodeling complexes promote tyrosine kinase inhibitor resistance in EGFR-mutant lung cancer. Cancer Cell 41, 1516–1534 (2023).
Duplaquet, L. et al. Mammalian SWI/SNF complex activity regulates POU2F3 and constitutes a targetable dependency in small cell lung cancer. Cancer Cell 42, 1352–1369 (2024).
Vaswani, R. G. et al. Discovery of FHD-286, a first-in-class, orally bioavailable, allosteric dual inhibitor of the brahma homologue (BRM) and brahma-related gene 1 (BRG1) ATPase activity for the treatment of SWItch/sucrose non-fermentable (SWI/SNF) dependent cancers. J. Med. Chem. 68, 1772–1792 (2025).
Fiskus, W. C. et al. Pre-clinical efficacy of targeting baf complexes through inhibition of the dual atpases BRG1 and BRM by FHD-286 in cellular models of AML of diverse genetic background. Blood 140, 8819–8820 (2022).
Tsherniak, A. et al. Defining a cancer dependency map. Cell 170, 564–576 (2017).
Mathur, R. et al. ARID1A loss impairs enhancer-mediated gene regulation and drives colon cancer in mice. Nat. Genet. 49, 296–302 (2016).
Helming, K. C. et al. ARID1B is a specific vulnerability in ARID1A-mutant cancers. Nat. Med. 20, 251–254 (2014).
Kelso, T. W. R. et al. Chromatin accessibility underlies synthetic lethality of SWI/SNF subunits in ARID1A-mutant cancers. eLife 6, e30506 (2017).
Wang, Z. et al. Dual ARID1A/ARID1B loss leads to rapid carcinogenesis and disruptive redistribution of BAF complexes. Nat. Cancer 1, 909–922 (2020).
Bolomsky, A. et al. IRF4 requires ARID1A to establish plasma cell identity in multiple myeloma. Cancer Cell 42, 1185–1201 (2024).
Sun, X. et al. Arid1a has context-dependent oncogenic and tumor suppressor functions in liver cancer. Cancer Cell 32, 574–589 (2017).
Banito, A. et al. The SS18–SSX oncoprotein hijacks KDM2B-PRC1.1 to drive synovial sarcoma. Cancer Cell 33, 527–541 (2018).
McBride, M. J. et al. The SS18–SSX fusion oncoprotein hijacks BAF complex targeting and function to drive synovial sarcoma. Cancer Cell 33, 1128–1141 (2018).
Uhlén, M. et al. Tissue-based map of the human proteome. Science 347, 1260419 (2015).
Uhlén, M. et al. A pathology atlas of the human cancer transcriptome. Science 357, eaan2507 (2017).
Peters, J.-M., Tedeschi, A. & Schmitz, J. The cohesin complex and its roles in chromosome biology. Genes Dev. 22, 3089–3114 (2008).
Ong, C.-T. & Corces, V. G. CTCF: an architectural protein bridging genome topology and function. Nat. Rev. Genet. 15, 234–246 (2014).
Zuin, J. et al. Cohesin and CTCF differentially affect chromatin architecture and gene expression in human cells. Proc. Natl Acad. Sci. USA 111, 996–1001 (2014).
Do, C. et al. Motif grammar and transcriptional programs decouple CTCF binding from nucleosome phasing to control cell-type-specific chromatin insulation. Cell Rep. 45, 117316 (2026).
Hyle, J. et al. Acute depletion of CTCF directly affects MYC regulation through loss of enhancer–promoter looping. Nucleic Acids Res. 47, 6699–6713 (2019).
Moore, J. M. et al. Loss of maternal CTCF is associated with peri-implantation lethality of ctcf null embryos. PLoS ONE 7, e34915 (2012).
Schep, A. N. et al. Structured nucleosome fingerprints enable high-resolution mapping of chromatin architecture within regulatory regions. Genome Res. 25, 1757–1770 (2015).
Rao, S. S. P. et al. A 3D map of the human genome at kilobase resolution reveals principles of chromatin looping. Cell 159, 1665–1680 (2014).
Davidson, I. F. & Peters, J.-M. Genome folding through loop extrusion by SMC complexes. Nat. Rev. Mol. Cell Biol. 22, 445–464 (2021).
Hamley, J. C., Li, H., Denny, N., Downes, D. & Davies, J. O. J. Determining chromatin architecture with Micro Capture-C. Nat. Protoc. 18, 1687–1711 (2023).
Hsieh, T.-H. S. et al. Mapping nucleosome resolution chromosome folding in yeast by micro-c. Cell 162, 108–119 (2015).
Dixon, J. R., Gorkin, D. U. & Ren, B. Chromatin domains: the unit of chromosome organization. Mol. Cell 62, 668–680 (2016).
Szabo, Q., Bantignies, F. & Cavalli, G. Principles of genome folding into topologically associating domains. Sci. Adv. 5, eaaw1668 (2019).
Bunting, K. L. et al. Multi-tiered reorganization of the genome during B cell affinity maturation anchored by a germinal center-specific locus control region. Immunity 45, 497–512 (2016).
Mashtalir, N. et al. Modular organization and assembly of SWI/SNF family chromatin remodeling complexes. Cell 175, 1272–1288 (2018).
Shishodia, S. et al. Selective and cell-active PBRM1 bromodomain inhibitors discovered through NMR fragment screening. J. Med. Chem. 65, 13714–13735 (2022).
Xiao, M. et al. BRD9 determines the cell fate of hematopoietic stem cells by regulating chromatin state. Nat. Commun. 14, 8372 (2023).
Boyle, A. P. et al. High-resolution genome-wide in vivo footprinting of diverse transcription factors in human cells. Genome Res. 21, 456–464 (2011).
Schmidt, D. et al. Waves of retrotransposon expansion remodel genome organization and CTCF binding in multiple mammalian lineages. Cell 148, 335–348 (2012).
Schmitz, R. et al. Genetics and pathogenesis of diffuse large B-cell lymphoma. N. Engl. J. Med. 378, 1396–1407 (2018).
Wright, G. W. et al. A probabilistic classification tool for genetic subtypes of diffuse large B cell lymphoma with therapeutic implications. Cancer Cell 37, 551–568 (2020).
Mesin, L., Ersching, J. & Victora, G. D. Germinal center B cell dynamics. Immunity 45, 471–482 (2016).
Basso, K. & Dalla-Favera, R. Germinal centres and B cell lymphomagenesis. Nat. Rev. Immunol. 15, 172–184 (2015).
Silva, N. S. D. & Klein, U. Dynamics of B cells in germinal centres. Nat. Rev. Immunol. 15, 137–148 (2015).
Vilarrasa-Blasi, R. et al. Dynamics of genome architecture and chromatin function during human B cell differentiation and neoplastic transformation. Nat. Commun. 12, 651 (2021).
Rivas, M. A. & Melnick, A. M. Role of chromosomal architecture in germinal center B cells and lymphomagenesis. Curr. Opin. Hematol. 26, 294–302 (2019).
Rivas, M. A. et al. Smc3 dosage regulates B cell transit through germinal centers and restricts their malignant transformation. Nat. Immunol. 22, 240–253 (2021).
Sungalee, S. et al. Germinal center reentries of BCL2-overexpressing B cells drive follicular lymphoma progression. J. Clin. Invest. 124, 5337–5351 (2014).
Egle, A., Harris, A. W., Bath, M. L., O’Reilly, L. & Cory, S. VavP-Bcl2 transgenic mice develop follicular lymphoma preceded by germinal center hyperplasia. Blood 103, 2276–2283 (2004).
Rivas, M. A. et al. Cohesin core complex gene dosage contributes to germinal center derived lymphoma phenotypes and outcomes. Front. Immunol. 12, 688493 (2021).
Deng, Q. et al. SMARCA4 is a haploinsufficient B cell lymphoma tumor suppressor that fine-tunes centrocyte cell fate decisions. Cancer Cell 42, 605–622 (2024).
Pillidge, Z. & Bray, S. J. SWI/SNF chromatin remodeling controls Notch-responsive enhancer accessibility. EMBO Rep. 20, e46944 (2019).
Abraham, A. et al. Arid1a-dependent canonical BAF complex suppresses inflammatory programs to drive efficient germinal center B cell responses. Nat. Immunol. 25, 1704–1717 (2024).
Ho, L. et al. esBAF facilitates pluripotency by conditioning the genome for LIF/STAT3 signalling and by regulating polycomb function. Nat. Cell Biol. 13, 903–913 (2011).
Kadoch, C. et al. Dynamics of BAF–polycomb complex opposition on heterochromatin in normal and oncogenic states. Nat. Genet. 49, 213–222 (2017).
Chambers, C. et al. SWI/SNF blockade disrupts PU.1-directed enhancer programs in normal hematopoietic cells and acute myeloid leukemia. Cancer Res. 83, 983–996 (2023).
Yuan, J., Chen, K., Zhang, W. & Chen, Z. Structure of human chromatin-remodelling PBAF complex bound to a nucleosome. Nature 605, 166–171 (2022).
Wang, L. et al. Structure of nucleosome-bound human PBAF complex. Nat. Commun. 13, 7644 (2022).
Kitchen, N. S. & Schoenherr, C. J. Sumoylation modulates a domain in CTCF that activates transcription and decondenses chromatin. J. Cell. Biochem. 111, 665–675 (2010).
Corin, A., Nora, E. P. & Ramani, V. Beyond genomic weaving: molecular roles for CTCF outside cohesin loop extrusion. Curr. Opin. Genet. Dev. 90, 102298 (2025).
Hakimi, M.-A. et al. A chromatin remodelling complex that loads cohesin onto human chromosomes. Nature 418, 994–998 (2002).
Shang, X.-Y. et al. ARID1A deficiency weakens BRG1–RAD21 interaction that jeopardizes chromatin compactness and drives liver cancer cell metastasis. Cell Death Dis. 12, 990 (2021).
Marino, M. M. et al. Interactome mapping defines BRG1, a component of the SWI/SNF chromatin remodeling complex, as a new partner of the transcriptional regulator CTCF. J. Biol. Chem. 294, 861–873 (2019).
Baxter, A. E. et al. The SWI/SNF chromatin remodeling complexes BAF and PBAF differentially regulate epigenetic transitions in exhausted CD8+ T cells. Immunity 56, 1320–1340 (2023).
McDonald, B. et al. Canonical BAF complex activity shapes the enhancer landscape that licenses CD8+ T cell effector and memory fates. Immunity 56, 1303–1319 (2023).
Mayran, A. & Drouin, J. Pioneer transcription factors shape the epigenetic landscape. J. Biol. Chem. 293, 13795–13804 (2018).
Zaret, K. S. & Carroll, J. S. Pioneer transcription factors: establishing competence for gene expression. Genes Dev. 25, 2227–2241 (2011).
Rosmarin, A. G., Yang, Z. & Resendes, K. K. Transcriptional regulation in myelopoiesis: hematopoietic fate choice, myeloid differentiation, and leukemogenesis. Exp. Hematol. 33, 131–143 (2005).
Si-Tayeb, K., Lemaigre, F. P. & Duncan, S. A. Organogenesis and development of the liver. Dev. Cell 18, 175–189 (2010).
Lambert, S. A. et al. The human transcription factors. Cell 172, 650–665 (2018).
Netherton, M. R. Discovery of FHD-609, a potent and selective heterobifunctional degrader of BRD9. In 18th Annual Drug Discovery Chemistry Meeting (2023).
Corces, M. R. et al. An improved ATAC–seq protocol reduces background and enables interrogation of frozen tissues. Nat. Methods 14, 959–962 (2017).
Slobodyanyuk, E., Cattoglio, C. & Hsieh, T.-H. S. Mapping mammalian 3D genomes by Micro-C. In Spatial Genome Organization. Methods in Molecular Biology Vol. 2532 (ed. Sexton, T) 51–71 https://doi.org/10.1007/978-1-0716-2497-5_4 (Humana, 2022).
Picard toolkit (Broad Institute, 2019).
Zhang, Y. et al. Model-based analysis of ChIP–seq (MACS). Genome Biol. 9, R137 (2008).
Orchard, P., Kyono, Y., Hensley, J., Kitzman, J. O. & Parker, S. C. J. Quantification, dynamic visualization, and validation of bias in ATAC–seq data with ataqv. Cell Syst. 10, 298–306.e4 (2020).
Ewels, P., Magnusson, M., Lundin, S. & Käller, M. MultiQC: summarize analysis results for multiple tools and samples in a single report. Bioinformatics 32, 3047–3048 (2016).
Liao, Y., Smyth, G. K. & Shi, W. featureCounts: an efficient general purpose program for assigning sequence reads to genomic features. Bioinformatics 30, 923–930 (2014).
Love, M. I., Huber, W. & Anders, S. Moderated estimation of fold change and dispersion for RNA-seq data with DESeq2. Genome Biol. 15, 550 (2014).
McLean, C. Y. et al. GREAT improves functional interpretation of cis-regulatory regions. Nat. Biotechnol. 28, 495–501 (2010).
Subramanian, A. et al. Gene set enrichment analysis: a knowledge-based approach for interpreting genome-wide expression profiles. Proc. Natl Acad. Sci. USA 102, 15545–15550 (2005).
Liberzon, A. et al. The Molecular Signatures Database (MSigDB) hallmark gene set collection. Cell Syst. 1, 417–425 (2015).
Castro-Mondragon, J. A. et al. JASPAR 2022: the 9th release of the open-access database of transcription factor binding profiles. Nucleic Acids Res. 50, D165–D173 (2022).
Heinz, S. et al. Simple combinations of lineage-determining transcription factors prime cis-regulatory elements required for macrophage and B cell identities. Mol. Cell 38, 576–589 (2010).
Bentsen, M. et al. ATAC–seq footprinting unravels kinetics of transcription factor binding during zygotic genome activation. Nat. Commun. 11, 4267 (2020).
Li, H. & Durbin, R. Fast and accurate short read alignment with Burrows–Wheeler transform. Bioinformatics 25, 1754–1760 (2009).
Li, H. & Durbin, R. Fast and accurate long-read alignment with Burrows–Wheeler transform. Bioinformatics 26, 589–595 (2010).
Li, H. Aligning sequence reads, clone sequences and assembly contigs with BWA-MEM. Preprint at https://doi.org/10.48550/arXiv.1303.3997 (2013).
Talevich, E., Shain, A. H., Botton, T. & Bastian, B. C. CNVkit: genome-wide copy number detection and visualization from targeted DNA sequencing. PLoS Comput. Biol. 12, e1004873 (2016).
Stuart, T., Srivastava, A., Madad, S., Lareau, C. A. & Satija, R. Single-cell chromatin state analysis with signac. Nat. Methods 18, 1333–1341 (2021).
Korsunsky, I. et al. Fast, sensitive and accurate integration of single-cell data with harmony. Nat. Methods 16, 1289–1296 (2019).
Ewels, P. A. et al. The nf-core framework for community-curated bioinformatics pipelines. Nat. Biotechnol. 38, 276–278 (2020).
Frankenfield, A. M., Ni, J., Ahmed, M. & Hao, L. Protein contaminants matter: building universal protein contaminant libraries for DDA and DIA proteomics. J. Proteome Res. 21, 2104–2113 (2022).
Dozmorov, M. G. et al. CTCF: Genomic coordinates of CTCF binding sites, with orientation. GitHub https://doi.org/10.18129/B9.bioc.CTCF (2022).
Ziebarth, J. D., Bhattacharya, A. & Cui, Y. CTCFBSDB 2.0: a database for CTCF-binding sites and genome organization. Nucleic Acids Res. 41, D188–D194 (2013).
Acknowledgements
We thank W. Béguelin, C. Leslie, J. Skok and Y. David and members of their laboratories for valuable feedback; H. Shen, G. Fayzikhodjaeva, E. Char, I. Duba, B. Mis, K. Kasliwal and A. Lidosk for support with experiments, analyses and mouse colonies; M. Green and D. Landau and members of their laboratories for feedback; staff at Foghorn Therapeutics for small-molecule inhibitors and degraders; staff at the Epigenomics, Genomics, and Flow Cytometry cores (Weill Cornell Medicine) for assistance; and D. Landau’s Laboratory for providing us with melanoma and AML cell lines. The mouse ovarian cell line was a gift from N. B. Chetrit’s Laboratory.
Funding
D.B. was supported by NCI R00 CA246080, a Leukemia Research Foundation Research grant, The Andrew McDonough B+ Foundation Grant, a LLS SCOR 7037-25 grant and STARR Foundation Grant I17-0131. C.E.M. was supported by R01 CA266279. A.M. was supported by R35 CA220499, LLS SCOR 7021-20 and an IFLI Collaborative Research Award. A.O. was supported by Human Frontier Science LT000160/2021-C. V.I.R. was supported by New Innovator Award 1DP2GM150021-01, The Rita Allen Foundation S-2108-02147 and the Irma T. Hirschl/Monique Weill-Caulier Trust. M.S. was supported by R01 GM145864, R03 NS135564, the Simons Foundation and the Tri-Institutional Stem Cell Initiative. C.R.C. was supported by T32AR071302. M.A.R. was supported by an ASH Scholar Award. B.P. was supported by German Research Foundation (DFG) PE3140/1-1 and a LRF Postdoctoral Fellowship.
Author information
Author notes
These authors contributed equally: Sonia Debek, Cem Meydan, Christopher R. Chin
These authors jointly supervised this work: Ari Melnick and Darko Barisic
Authors and Affiliations
Department of Medicine, Weill Cornell Medicine, Cornell University, New York, NY, USA
Sonia Debek, Cem Meydan, Christopher R. Chin, Jiali Yu, Ioanna Tsialta, Benedikt Pelzer, Alejandra Laguillo-Diego, Laurianne Scourzic, Sravya Tumuluru, Matt Teater, Brian Darsow, Matthias Stadtfeld, Effie Apostolou & Darko Barisic
Department of Physiology and Biophysics, Weill Cornell Medicine, New York, NY, USA
Cem Meydan, Christopher R. Chin & Christopher E. Mason
The HRH Prince Alwaleed Bin Talal Bin Abdulaziz Al-Saud Institute for Computational Biomedicine, Weill Cornell Medicine, New York, NY, USA
Cem Meydan & Christopher E. Mason
Meyer Cancer Center, Weill Cornell Medical College, New York, NY, USA
Christopher R. Chin, Alejandra Laguillo-Diego, Laurianne Scourzic, Matthias Stadtfeld, Effie Apostolou & Darko Barisic
Graduate Program of Physiology, Biophysics and Systems Biology, Weill Cornell Medicine, New York, NY, USA
Ceyda Durmaz
Barts Cancer Institute, John Vane Science Centre, Queen Mary University of London, London, UK
Constance Maurer
Laboratory of Genome Architecture and Dynamics, The Rockefeller University, New York, NY, USA
Arnold Ou & Viviana I. Risca
Memorial Sloan Kettering Cancer Center, New York, NY, USA
Rui Wu, Jose Luis Marin-Rubio & Kojo S. J. Elenitoba-Johnson
University of Miami, Sylvester Comprehensive Cancer Center, Miami, FL, USA
Martin A. Rivas
Josep Carreras Leukaemia Research Institute, Barcelona, Spain
Ari Melnick
Authors
- Sonia Debek
- Cem Meydan
- Christopher R. Chin
- Jiali Yu
- Ceyda Durmaz
- Ioanna Tsialta
- Benedikt Pelzer
- Constance Maurer
- Arnold Ou
- Alejandra Laguillo-Diego
- Laurianne Scourzic
- Sravya Tumuluru
- Matt Teater
- Rui Wu
- Brian Darsow
- Martin A. Rivas
- Jose Luis Marin-Rubio
- Matthias Stadtfeld
- Effie Apostolou
- Christopher E. Mason
- Kojo S. J. Elenitoba-Johnson
- Viviana I. Risca
- Ari Melnick
- Darko Barisic
Contributions
D.B. and A.M. conceived the study and designed the experiments. S.D., D.B., J.Y., I.T., B.D., S.T., L.S. and A.L.-D. performed the cell biology and cell line experiments. S.D., D.B., I.T. and A.O. performed all the genomic experiments. S.D., R.W. and J.L.M.-R. performed the MS experiments. B.P., D.B., M.A.R., L.S. and S.T. performed the mouse experiments. C. Meydan led the computational analyses and data curation. C. Meydan, C.R.C., C.D., M.T., C. Maurer and D.B. performed computational analyses. C. Meydan, C.R.C., C.D., M.T., C. Maurer, S.D. and D.B. performed data visualization. D.B. wrote the manuscript, and all authors contributed to review and editing. Supervision was provided by C.E.M., E.A., M.S., K.S.J.E.J., V.I.R., A.M. and D.B. Project administration and funding acquisition were led by D.B. and A.M.
Corresponding authors
Correspondence to Cem Meydan, Ari Melnick or Darko Barisic.
Ethics declarations
Competing interests
A.M. has research funding from Janssen, Epizyme and Daiichi Sankyo. A.M. consulted for Exo Therapeutics, Treeline Biosciences, Astra Zeneca and Epizyme. C.E.M. is a co-founder and board member for Biotia and Onegevity Health as well as an advisor or grantee for Abbvie, ArcBio, Daiichi Sankyo, DNA Genotek, Tempus Labs and Whole Biome. V.I.R. has filed a patent application describing an alternative chromatin-conformation mapping method.
Peer review
Peer review information
Nature thanks Ralph Stadhouders and the other, anonymous, reviewers for their contribution to the peer review of this work. Peer reviewer reports are available.
Additional information
Publisher’s note Springer Nature remains neutral with regard to jurisdictional claims in published maps and institutional affiliations.
Extended data figures and tables
Extended Data Fig. 1 Loss of BAF function increases chromatin accessibility at CTCF-binding sites across multiple cell types.
(a) Conserved chromatin opening at CTCF sites across tissues. Variability analysis of ATAC-seq peaks opened or closed by BAF loss across cell types. Newly opened CTCF-associated peaks are broadly shared and show lower inter-tissue variability than closed peaks. This indicates that BAF loss elicits a common, conserved chromatin opening at CTCF sites across diverse lineages. (b) Peak overlap analysis across cell lines with genetic deletion of ARID1A. Peaks at CTCF motif are generally shared across cell lines, and heterozygous loss of ARID1A results in a similar phenotype to homozygous deletion. (c) Occurrence of CTCF motif in opening, stable and closing chromatin regions after ARID1A deletion, or FHD-286 treatment, or after CTCF deletion. CTCF binding sites predominantly become open after cBAF loss/inhibition. Closing of the CTCF motif in CTCF CRISPR shows that the opening of the sites corresponds to binding. (d) Basal CTCF mRNA levels in cancer cell lines (top) and normal cell types (bottom) from the Human Protein Atlas single-cell dataset. Each violin represents the distribution of normalized TPM (nTPM) values across cell lines within a given primary disease group. Lymphoid and myeloid cells exhibit the highest CTCF expression among all tissue types. Inner boxplots indicate the median and interquartile range (Q1-Q3). N is indicated in the Methods. (e) Correlation of RNA-seq and ATAC-seq differential peaks in ARID1AHet vs. ARID1A-WT RIVA cells, showing high concordance between changes in gene expression and alterations in promoter chromatin accessibility. The top panel anchors expression changes on differentially accessible peaks, the bottom panel anchors accessibility changes on differentially expressed genes. n = 3 technical replicates per genotype. Center dot is the median and error bars show 25th–75th percentiles, p-value is from ANOVA. (f) Scatter plots showing that CTCF deletion reverses the chromatin accessibility gains triggered by ARID1A loss. Each dot represents a genomic region identified in ATAC-Seq of ARID1AHet, ARID1AHetCTCF CRISPR and WT. The position of each dot reflects accessibility change in ARID1AHet vs WT (x axis), or ARID1AHet CTCF CRISPR vs WT (y axis). The colour of the dots represents accessibility change of that region in CTCF CRISPR vs WT, with red indicating putative CTCF-binding sites, i.e. regions which lose accessibility after CTCF deletion in WT cells. The top panel includes all peaks from ARID1AHet, ARID1AHet CTCF CRISPR and WT ATAC-Seq, while the bottom panel focuses on putative CTCF-binding sites within those peaks. Dots that shift back toward zero on the y-axis (ARID1AHet CTCF CRISPR vs. WT) indicate that removing CTCF reverses the aberrant accessibility caused by ARID1A loss. (g) Peak overlap analysis across cell lines comparing opening and closing regions in cell lines treated with FHD-286, or with knock-out or knock-down of ARID1A. Loss of cBAF function, whether through pharmacological inhibition or genetic deletion, results in concordant changes in chromatin accessibility, with the same peaks opening or closing in the same direction under both conditions. (h) Nucleosome occupancy profiles predicted from NucleoATAC shown over CTCF ChIP-seq peaks and centered on the CTCF motif. Profiles reveal reduced nucleosome occupancy at CTCF binding sites, accompanied by more clearly phased and organized nucleosomes flanking the motif in ARID1AHet compared to WT. This pattern is reversed with the addition of CTCF CRISPR to ARID1AHet background. Left: All CTCF peaks with the CTCF motif. Right: Increasing CTCF peaks in ARID1AHet vs WT. (i) Correlation between baseline CTCF-binding strength in WT cells (vertical axis, binned from strong to weak peaks) and the CTCF occupancy change for ARID1AHet vs. WT (horizontal axis). Stronger WT peaks show larger occupancy gains when ARID1A is lost, suggesting cBAF preferentially restrains high-affinity CTCF sites.
Extended Data Fig. 2 ARID1A loss increases CTCF occupancy and chromatin accessibility across species and with functional and clinical consequences.
(a) Schematic representation of the experiment and immunoblots showing the efficiency of ARID1A degradation after 6 h or 24 h in hES cells, representative from 3 independent experiments. (b) Motif enrichment after 6 h or 24 h of ARID1A degradation in hES showing that CTCF sites opening is a direct effect of cBAF loss, as the changes are present already at 6 h. Bars show multivariable linear model coefficient estimates from modeling peak log2 fold-change as a function of motif presence and GC content. Error bars show 95% Wald confidence intervals using heteroskedasticity consistent standard errors, and p-values are BH adjusted two-sided robust coefficient tests. Peaks derived from n = 2 biological replicates per condition. (c) Heatmaps showing ChIP signals of all CTCF peaks, or ARID1A binding at the CTCF-bound regions in hES cells after 6 h of ARID1A degradation or in DMSO-treated control, and log2 fold change of CTCF binding between dTAG- and DMSO-treated cells, as well as density plots showing CTCF or ARID1A-HA ChIP signal in all sites (n = 2, two biological replicates for each condition). (d) Pie charts showing proportions of peaks occupied by CTCF, SMC3 (cohesin) or both. The majority of newly accessible sites are cohesin-bound insulator elements. (e) Schematics of the time-course experiment. RIVA cells were treated with FHD-286 and subjected to ATAC-seq after 4 h, 12 h and 24 h of treatment. Motif enrichment analysis shows that opening of CTCF-binding sites occurs as early as at 4 h of treatment and persists through 24 h, arguing that increased CTCF accessibility is a direct effect of BAF loss. Bars and error bars calculated as in (b). Peaks derived from n = 2 technical replicates per condition. (f) Schematic representation of the experimental design. Cells were isolated from mouse embryos and transduced with either a Cre-GFP-expressing vector to induce gene deletion or a GFP-only control vector. GFP-positive cells were sorted and subjected to a CellTiter-Glo proliferation assay. Proliferation at 24 h (relative to 0 h) is presented as the fold-change in luminescence signal of knockout cells compared to their corresponding control cells derived from the same embryo. Two independent embryos were analyzed per genotype, with data from different embryos indicated by distinct symbols (circles or triangles). n = 16 for Arid1aHet and Arid1aHetCtcfHet (2 embryos, 8 technical replicates each) and n = 8 for CtcfHet (2 embryos, 4 technical replicates each). Statistical significance was determined using two-way ANOVA. Error bars represent mean ± SD. (g) Representative proliferation curves of cells derived from a single embryo over 72 h (n = 4 technical replicates per genotype, experiment conducted 2 times, using different embryos of each genotype in each experiment). Statistical significance was assessed by two-way ANOVA, and the p-value for the genotype factor is indicated in each graph. Error bars represent mean ± SD. (h) Overall survival of patients in the pan-cancer TCGA cohort (PMID: 24071849) stratified by CTCF expression z-scores (n = 6,931). Hazard ratios (HRs) were calculated relative to the “Very High” CTCF expression group (> 4), and log-rank tests were performed in cBioPortal (PMID: 22588877). Kaplan–Meier curves are displayed through 90 months of follow-up. High CTCF expression is associated with poorer prognosis. (i) ATAC-seq performed 48 h post CRISPR in D. melanogaster cell line S2. Immunoblot confirming the reduction of Osa expression. PCA of ATAC-Seq shows clear separation of chromatin accessibility status between WT and osa knock out samples. n = 4, comprising 2 technical replicates from two independent CRISPR reactions targeting two different parts of osa gene. (j) ATAC-seq motif enrichment in osa-deleted samples shows opening of chromatin regions that contain binding motifs for fruit fly insulators Su(Hw), BEAF, CTCF and cohesin-associated (Pnr) proteins. Bars and error bars calculated as in (b). Peaks derived from n = 2 biological replicates per condition. Gel source data are provided in Supplementary Fig. 1. Schematic in f created in BioRender; Debek, S. https://biorender.com/ejlfwm8 (2026).
Extended Data Fig. 3 Independent biochemical approaches confirm the PBAF-CTCF interaction across cell lines.
(a) Left: Western blot analysis of CTCF immunoprecipitation with and without the addition of endonuclease (Benzonase). CTCF-PBRM1 interaction is preserved after the digestion of nucleic acids, supporting the suggested direct interaction between the proteins. Representative blot from two technical replicate runs using samples from a single experiment. Right: DNA concentration in the sample before and after endonuclease treatment measured by BioAnalyzer (Agilent). (b) Reciprocal immunoprecipitation of CTCF and PBRM1 in SUM159 cell line followed by immunoblot analysis, confirming that CTCF preferentially interacts with PBAF components. Representative blot from two independent experiments. (c) Same as in (b) for Raji cell line. Representative blot from two independent experiments. (d) CTCF does not co-fractionate with cBAF in wild-type cells. Glycerol gradient fractionation of nuclear extracts from SUM159 cells, and immunoblot analysis for the cBAF subunit ARID1A, the PBAF-specific subunit PBRM1, shared BAF components, cohesin (SMC3), and CTCF. In WT cells, both cBAF and PBAF subunits sediment in high-molecular-weight fractions (corresponding to higher glycerol percentages), consistent with their expected size (~1.5–2 MDa). In contrast, CTCF is predominantly detected in lower-molecular-weight fractions, separate from PBAF, while cohesin (SMC3) also distributes in distinct fractions. These data indicate that under basal conditions, CTCF does not stably associate with the PBAF complex. Representative blot analysis from two independent experiments. (e) cBAF loss enhances CTCF-PBAF association. Glycerol gradient profiles from ARID1A-Hom (cBAF-deficient) cells reveal a redistribution of CTCF toward higher-molecular-weight fractions that overlap with PBAF-containing fractions. The PBAF-specific subunit PBRM1 remains enriched in these heavy fractions, and CTCF abundance in these fractions is substantially increased compared to WT cells. This shift suggests that loss of cBAF promotes association between CTCF and PBAF-containing complexes. Representative blot analysis from two independent experiments. (f) Heatmaps showing ARID1A binding (ChIP-seq) in WT, ARID1AHet or WT FHD-286-treated SUM159 cells (n = 3 replicates for WT and ARID1AHet, and n = 2 for FHD-286-treated). (g) Same as (f), but or PBRM1. PBAF occupancy is increased after FHD-286 treatment, while cBAF shows a decrease. Peak order is identical to (f). (h) Proportion of ARID1A- or PBRM1-bound regions that close (ATAC Down) or open (ATAC Up) after pan-BAF inhibition with FHD-286. The closing peaks are predominantly occupied by cBAF (ARID1A), suggesting that FHD-286 primarily targets cBAF, which potentially enables PBAF to expand its activity. (i) Immunoprecipitation of CTCF followed by immunoblot analysis in RIVA and SUM159 cells treated with FHD-286, or DMSO. CTCF-PBAF interaction is not affected by BAF inhibition. Representative blot from an experiment performed in two clones for each cell line, in two technical western blot repetitions. (j) Western blot validation of selective BAF degraders, confirming on-target effects for PBAF and ncBAF inhibition. Representative blot from 3 independent experiments. Gel source data are provided in Supplementary Fig. 1. (k) Heatmaps (top) and density plots (bottom) showing log2 fold change ATAC signal at summits overlapping with CTCF ChIP peaks in RIVA ARID1AHet (left) or WT (right) cells treated with PBRM1i or DMSO after 24 hours (n=3 for each condition).
Extended Data Fig. 4 Chromatin state analysis reveals PBAF replaces cBAF at CTCF-bound insulators.
(a) Multi-mark chromatin segmentation pipeline overview, showing the input for the model: accessibility (ATAC-seq), chromatin binding (CTCF and PBRM1 ChIP-seq) in WT, as well as their log2 fold change between ARID1AHet and WT. (b) Profile plots of input samples for the MMM model showing signal and log2 fold change. (c) Input datasets for the model. Upper panel: WT values for ATAC-seq, PBRM1, and CTCF ChIP-seq. Lower panel: log2 fold change comparison between ARID1AHet and WT, highlighting differential chromatin accessibility and binding patterns in response to BAF loss. (n = 4 per condition for ATAC, n = 3 for PBRM1, n = 6 for CTCF). Dashed outlines indicate top CTCF-gaining clusters with matched ATAC-seq gains in BAF inhibitor and cell line atlas data in the same regions. (d) Model readouts. RNA expression profiling of genomic clusters affected by BAF loss. CTCF-Increasing clusters (G1-G8) show transcriptional upregulation in their proximal genes, suggesting that increased CTCF accessibility corresponds with changes in gene activity. ChIP/CNR log2 fold-change readout includes BAF subunits (BRD7, SMARCA4, ARID1A), cohesin (SMC3), and active histone modifications (H3.3, H3K27ac). BRD7, a PBAF-specific subunit, is also enriched at CTCF-increasing cluster sites, along with increased cohesin (SMC3) and core BAF complex components, whereas ARID1A, a cBAF subunit, is depleted in most affected clusters. Also, analysis of histone modifications reveals that regions gaining CTCF binding exhibit a gain of H3K27ac and increased nucleosome turnover as indicated by H3.3 incorporation. (n = 6 per condition for RNA-seq, n = 4 for BRD7, n = 1 for SMARCA4, n = 3 for ARID1A, n = 2 for SMC3, n = 3 for H3.3, n = 3 for H3K27ac. In violin plot center dot is the median and error bars show 25th–75th percentiles). (e) ATAC-seq log2 fold change analysis comparing the effects of pan-BAF, and PBAF inhibition vs. DMSO. Loss of cBAF leads to increased chromatin accessibility at CTCF-associated loci, whereas PBAF inhibition reduces accessibility, highlighting a compensatory role for PBAF in the absence of cBAF (n = 3–4 for each condition and treatment). (f) Same analysis as (e) but across cell lines in the ATAC-seq dataset (Fig. 1). Most cell lines exhibit a general increase in CTCF accessibility. n = 3 to 6 per condition across the cell lines. (g) Distribution of CTCF motif abundance across clusters. CTCF-Increasing clusters show a strong enrichment of the M1 CTCF motif, consistent with the observation that high-occupancy CTCF sites are most affected by BAF loss. (h) Magnified inset of CTCF binding distribution in the segmented chromatin regions for the CTCF gain clusters. Left: Mean of WT CTCF signal for each cluster. Right: log2 fold change between ARID1AHet and WT. (Profiles shown are cluster center ±1 kb. n = 6 per condition). (i) Left: TAD Insulation Score analysis in WT cells, showing that CTCF-Increasing clusters from (h) exhibit higher insulation (lower scores), suggesting that these sites act as stronger insulators in the genome. Right: Delta TAD insulation between ARID1AHet and WT, highlighting that the largest gains in insulation (shaded red) occur within CTCF-Increasing clusters, further linking BAF loss to genome structural changes (Profiles shown are center +/− 100 kb, using 10 kb bins. n = 2 per condition for Micro-C, pooled).
Extended Data Fig. 5 cBAF LOF Favors Proximal CTCF–PBAF Loop Anchors at the Expense of Long-Range Enhancer Contacts.
(a-b) log2 fold change relative contact probability (HET/WT) across genomic distances for regions containing either differentially increased or stable CTCF (a) and SMC3 (b) peaks. Gray bands show 95% confidence interval. (c) Waterfall plot representing the delta connectivity score differences between ARID1AHet and ARID1A WT cells in single-cell multiome. (d) Expression of genes with the highest gain of connectivity due to ARID1A loss in ARID1A WT (left) and ARID1AHet (right) projected onto UMAP dimensionality reduction based on Harmony corrected RNA and ATAC. (e) Example genome track showing DORC (domains of regulatory chromatin) connectivity of peaks linked to gene expression in ARID1AHet and WT cells. (f) Expression of genes with DORCs. p value = 1e-300 by two-sided Wilcoxon rank sum. n = 12704 cells for ARID1A WT and n = 13940 cells for ARID1AHet. (g) DORC connectivity score of regions with increased CTCF binding (ChIP peaks) in ARID1AHet vs. WT cells. Significance of connectivity measured by two-sided Wilcoxon rank sum test with a p-value = 1.9e-09. Number of DORCs identified in only WT, or only ARID1AHet cells. p-value = 1.4e-39 by fishers exact test. n is indicated in the right panel. (h) Expression of genes linked to regions with increased CTCF binding. p-value = 1e-300 by two-sided Wilcoxon rank sum. n = 543 genes. (i-j) Same as (g) and (h), but for PBRM1 peaks. p-values = 3.0e-12, 3.7e-46, and 1e-300 respectively. n = 442 genes. (k-l) Same as (g) and (h), but for BRD7 peaks. p-values = 1.5e-26, 1.4e-53 and 1e-300 respectively. n = 564 genes. For f, g, h, i, j, k, l center dot is the median and error bars show 25th–75th percentiles.
Extended Data Fig. 6 cBAF loss reorganizes 3D genome architecture, strengthening TAD boundaries and intra-TAD contacts, while PBAF loss partially attenuates this effect.
All panels show aggregated data from two clones for each genotype, in n = 3 technical replicates per clone. (a) Contour scatterplot showing log2 fold-change of intra-TAD vs. inter-TAD connectivity changes across the three genotypes, showing that BAF loss leads to increased intra-TAD interactions which are mostly reverted in ARID1AHetARID2Hom cells. (b) The inter-TAD vs intra-TAD connectivity ratios across all TADs. The decrease in the inter-/intra-TAD ratio observed in ARID1AHet cells gets reverted in ARID1AHetARID2Hom. p-values calculated with two-sided Wilcoxon rank-sum test. Boxplots display median and IQR (Q1-Q3), with whiskers extending to values within 1.5 IQR. (c) Aggregate TAD analysis (ATA) plot on Micro-C matrix showing delta difference between WT and ARID1AHetARID2Hom compared to ARID1AHet in strengthening TADs (top) and weakening TADs (bottom). (d) Aggregate peak analysis (APA) plots centered on all TAD boundaries. Left: WT signal shown as enrichment of observed signal normalized to randomly shifted local background, indicating the insulation valley around the boundary separating the flanking TADs. Center: Loss of inter-TAD connectivity and increased insulation in ARID1AHet compared to WT. Right: Partial normalization of inter-TAD connection and reduction in insulation in ARID1AHetARID2Hom compared to ARID1AHet. (e) The example loci from Fig. 3d with the addition of ARID1AHetARID2Hom and delta comparison to ARID1AHet, indicating a partial reversal of connectivity changes and normalization of inter-TAD connection with ARID2 deletion on ARID1AHet background. In CTCF/SMC3 log2 fold change tracks, red and blue indicate positive and negative log2 fold change values, respectively, between ARID1AHet and WT ChIP-seq peaks. ChIP track display CPM signal plotted on a common scale.
Extended Data Fig. 7 Loss of cBAF enhances P-E connectivity, partially reverted by PBAF loss.
(a) Waterfall plot representing the delta connectivity score differences between ARID1AHet and ARID1A WT cells, as well as ARID1AHetARID2Hom and ARID1AHet in single-cell multiome. Genes were ordered by the difference in connectivity between ARID1AHet and WT cells. (b) Expression of genes with the highest gain of connectivity due to ARID1A loss (ARID1AHet vs WT) in ARID1A WT (left) and ARID1AHet (middle) and ARID1AHetARID2Hom (right) projected onto UMAP dimensionality reduction based on Harmony corrected RNA and ATAC. (c) Violin plot (left) showing DORC connectivity scores of regions with significantly increased CTCF binding (ChIP peaks) in ARID1AHet vs WT, in WT, ARID1AHet or ARID1AHetARID2Hom cells. Indicated p-values for significance of connectivity were calculated by two-sided Wilcoxon rank sum test. Bar plot (right) showing number of DORCs identified in WT, ARID1AHet or ARID1AHetARID2Hom cells. Indicated p-values were calculated by fisher exact test. n is indicated in the right panel. (d) Violin plot (left) showing DORC connectivity scores of regions with significantly decreased CTCF binding (ChIP peaks) ARID1AHetARID2Hom vs ARID1AHet, in WT, ARID1AHet or ARID1AHetARID2Hom cells. Indicated p-values for significance of connectivity were calculated by two-sided Wilcoxon rank sum test. Bar plot (right) showing number of DORCs identified in WT, ARID1AHet or ARID1AHetARID2Hom cells. Indicated p-values were calculated by fisher exact test. n is indicated in the right panel. (e-h) Expression of genes gaining connectivity (e), or linked with BRD7 (f), CTCF (g) or PBRM1 (h). Indicated p-values were calculated by two-sided Wilcoxon rank sum test. n = 2459, 748, 748, and 573 genes respectively. (i) Example loci showing increased connectivity in ARID1AHet cells, and its reduction after the deletion of ARID2 (ARID1AHetARID2Hom). For c, d, e, f, g, h center dot is the median and error bars show 25th–75th percentiles.
Extended Data Fig. 8 ISWI and PBAF play a role in increasing CTCF chromatin occupancy in ARID1AHet context.
(a) Motif enrichment analysis of differentially accessible regions after the loss of cBAF (ARID1AHet), or cBAF and ISWI complexes (ARID1AHet, SMARCA5Hom) vs. WT RIVA cells. Deletion of SMARCA5, the catalytic subunit of ISWI, in ARID1AHet background results in widespread closure of CTCF sites, representing a reversal of the phenotype observed with ARID1A loss alone (n = 3 technical replicates from each of the 2 clones per genotype). Bars and error bars show multivariable linear model coefficient estimates and 95% Wald confidence intervals, and p-values are BH adjusted two-sided robust coefficient tests. Statistics were derived across n = 35,310 peaks. (b) Proliferation assay shows that the deletion of SMARCA5 eliminates the hyperproliferative phenotype of ARID1AHet cells. Data shown are from 4 independent experiments, with 3 technical replicates per clone in each experiment. Data from independent clones of the same genotype were pooled across independent experiments as biological replicates, yielding n = 4 for WT, n = 4 for ARID1AHet and n = 8 for ARID1AHetSMARCA5Hom. Two-way ANOVA p values for genotype × time interaction are indicated in the graph. Error bars represent mean ± SD. (c) Left: Venn diagram showing overlap of PBAF ChIP, CTCF ChIP, and ISWI-regulated ATAC sites. Right: Bar plot showing proportion of ISWI-regulated sites co-occupied by ISWI and CTCF, PBAF, both, or neither. Gel source data are provided in Supplementary Fig. 1.
Extended Data Fig. 9 cBAF loss alters chromatin accessibility and germinal center dynamics, with CTCF modulating dark zone expansion.
(a) Schematic representation of germinal center reaction (left) and the experiment (right) (b) Germinal center size is reduced by cBAF loss and not rescued by CTCF deletion. Flow cytometry quantification of germinal center B cell populations in conditional knockout mice (immunized with sheep red blood cells (SRBC). Mice with Arid1a haploinsufficiency in germinal center B cells show substantially smaller germinal centers compared to WT, indicating cBAF is required for normal GC formation (two-sided t-test). This GC size defect is not reversed in double-knockout (Arid1aHetCtcfHet) mice. The result suggests that while CTCF loss rescues the proliferative imbalance (dark zone expansion) caused by Arid1a loss, it does not restore overall GC size, consistent with other BAF-dependent factors (e.g., PU.1, NF-κB) controlling GC development. CTCF loss rescues dark zone expansion across immunization models (two-sided t-test). Phenotype of dark zone vs light zone composition in germinal centers after an independent antigen challenge (NP-KLH immunization). For SRBC immunization: WT n = 7 mice; Arid1aHet n = 9 mice; CtcfHet n = 3 mice; Arid1aHetCtcfHetn = 7 mice. For NP-KLH immunization: n = 7 mice from each genotype. Error bars represent mean ± SD. (c) PCA of chromatin accessibility in sorted DZ (CB, centroblasts) and LZ (CC, centrocytes) B cells, showing that the chromatin changes induced by Arid1a loss are reversed upon CTCF deletion. (d) Representation of PC1 values from (e). Boxplots display median and IQR (Q1-Q3), with whiskers extending to values within 1.5 IQR. (e) Top: Schematic representation of the experimental workflow. Bottom left: PCA of chromatin accessibility in sorted normal centroblast cells in WT, Arid1aHet, and Arid1aHom genotypes where PC1 separates the WT from cBAF loss. Bottom right: Projection of centroblast cells harvested from diseased Bcl2-Tg mouse on the same PCA space, showing that the tumour samples cluster with Arid1aHet samples in PC1. (f) Motif enrichment analysis of Bcl2-Tg+Arid1aHet mice compared to Bcl2-Tg background in pre-disease state (left) and after disease onset (center), showing an increase of Ctcf. Analysis performed as in Fig. 1a,g. Right: An example locus (proliferation marker Mki67) showing increased accessibility at CTCF motifs in the Bcl2-Tg+Arid1aHet samples. (g) CTCF motif enrichment calculated by comparing chromatin accessibility profiles of each individual mouse against healthy WT centroblasts. Bcl2-Tg+Arid1aHet tumors show similar levels of CTCF enrichment as Arid1aHet centroblasts on average, whereas Arid1a wild-type tumors show lower levels of enrichment. Center dot is the median and error bars show 25th–75th percentiles, p-values from two-sided t-test. (h) Flow cytometric analysis of germinal center dark zone phenotype in WT (n = 17), Arid1aHet (n = 10), Pbrm1Het (n = 14) and DKO (n = 17) mice, showing that loss of PBRM1 rescues the proliferative dark zone expansion phenotype caused by Arid1a deletion. Each dot represents a mouse used in phenotyping. Two-sided t-test, error bars represent mean ± SD. Panels e-g include n = 5 mice for WT and 3 for Arid1aHet in normals, n = 7 Bcl2-Tg, n = 13 Bcl2-Tg+Arid1aHet. Icons in b, e and h created in BioRender; Debek, S. https://biorender.com/wj90pea (2026).
Rights and permissions
Open Access This article is licensed under a Creative Commons Attribution 4.0 International License, which permits use, sharing, adaptation, distribution and reproduction in any medium or format, as long as you give appropriate credit to the original author(s) and the source, provide a link to the Creative Commons licence, and indicate if changes were made. The images or other third party material in this article are included in the article's Creative Commons licence, unless indicated otherwise in a credit line to the material. If material is not included in the article's Creative Commons licence and your intended use is not permitted by statutory regulation or exceeds the permitted use, you will need to obtain permission directly from the copyright holder. To view a copy of this licence, visit http://creativecommons.org/licenses/by/4.0/.
About this article
Cite this article
Debek, S., Meydan, C., Chin, C.R. et al. SWI/SNF complexes shape 3D chromatin architecture through CTCF and cohesin. Nature (2026). https://doi.org/10.1038/s41586-026-11197-w
Received: 21 April 2025
Accepted: 22 September 2026
Published: 28 October 2026
Version of record: 28 October 2026
DOI: https://doi.org/10.1038/s41586-026-11197-w